Decomposing Bond Yields
Let’s first think about the components of a bond’s yield.
At the simplest level, Treasury yields are simply the average expected Fed funds rate over the maturity plus a term premium. A good portion of the recent move in rates has been a direct consequence of the increase in rate hike expectations.
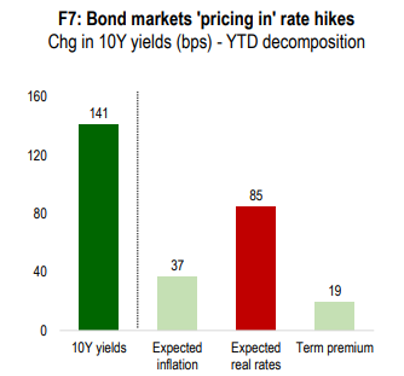 Note: Chart decomposes the change in 10-year Treasury yields YTD into its estimate expectations (inflation + real rates) and term premium components. Source: Numera Analytics
To show the decomposition, we’ve broken out the change in 10Y US Treasury yields so far this year. Directionally, the surge in yields reflects higher breakeven inflation, expectations of higher policy rates, and a wider term premium. However, most of the increase stems from a preemptive adjustment to tighter Fed policy, with a limited contribution from other shocks.
When you look at other fixed income instruments (outside of UST), we use Treasury yields as a starting point and add additional premium for liquidity, credit and the Option Adjust Spread (OAS). The last point sounds fancy, but it is simply the additional spread investors require in compensation for selling the issuer of the bond the “option” to repay it earlier than the stated maturity.
The next step to review is the concept of convexity and namely negative convexity. Bonds that have a call option that makes the payoff unpredictable have a higher “OAS” than bonds that have a stated call date or simple final maturity (bullet). Mortgage securities are a perfect example of a security with negative convexity. As with any investment, there are tradeoffs, and bond convexity is no different.
The positives of negative convexity – Investors buy mortgage bonds because of the higher amount of upfront cashflow (typically monthly) on the security compared to other types of bonds (part of the payment on a mortgage is split between principal and interest) plus the increase in compensation (i.e., higher yield) for selling the option. Investors typically favor higher coupon mortgages for even more interest rate protection (often bought at a premium to par). The higher current income from the mortgage makes them less interest rate sensitive as in theory the owner will have more cash to reinvest as rates rise.
The negatives – The owner of a mortgage security has zero say on when they will get their capital back (other than the final maturity of the bond). The homeowner (borrower) can die, move, refinance, pay faster (minimum payment + extra principal) or pay slower (pay only the minimum) at any point in time during the life of their mortgage. What we have seen lately is a massive slowdown in prepayment speeds given the rise in interest rates and in turn lack of incentives to refinance or sell their homes. This leads to a much different duration profile than what investors originally planned on (i.e., the bond duration extends as expected prepayments halt – let’s talk CPR “Constant Repayment Speeds” expectations offline). On the other side of the coin, when an investor buys a high coupon bond at a premium and rates fall, homeowners are incentivized to refinance, their option is in the money! This gives investors an ugly return profile (i.e., Pay >$100 and get back $100). On top of that, while most bond owners enjoy price appreciation on their bond from lower rates, mortgage owners aren’t so lucky. This is unfortunately what mortgage owners have faced the last several years of falling rates… negative convexity can bite both ways and there is a give for the higher current income.
How the Fed Comes into Play
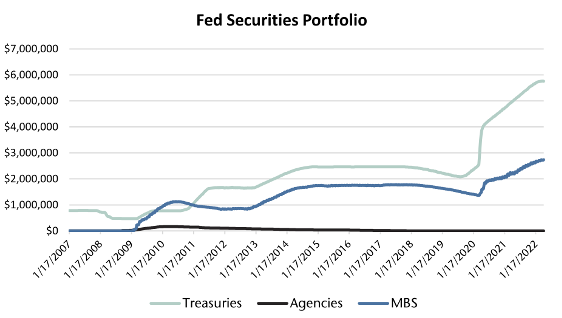
Source: Federal Reserve. As of 4.20.22
The Fed balance sheet assets fell $9.6 billion in the week ending Wednesday, April 20, to $8.956 trillion. Total Treasury holdings have risen $3.240 trillion since March 4, 2020, to a total of $5.763 trillion. MBS holdings have risen $1.358 trillion since March 4, 2020, to a total of $2.731 trillion. MBS comprise 1/3 of the Fed’s BS.
The latest Fed minutes laid out the Fed’s balance sheet reduction strategy. “Participants generally agreed that monthly caps of $60bn for treasury securities and $35bn for Agency MBS would likely be appropriate.” Big numbers here! And there was more: Participants also agreed to “consider asset sales of Agency MBS.”
Closer Look at the MBS Portfolio
The construction of the Feds portfolio changed drastically following COVID. While rates were at historic lows, homeowners went on a refi bonanza; lowering their mortgage rates and payments. The Fed artificially lowered mortgage rates because of the (overly extended timeframe) asset purchases, bringing yields lower. In turn, the Fed bought $1.358 trillion of mortgages at historically low rates. And we wonder why we still have rampant inflation!
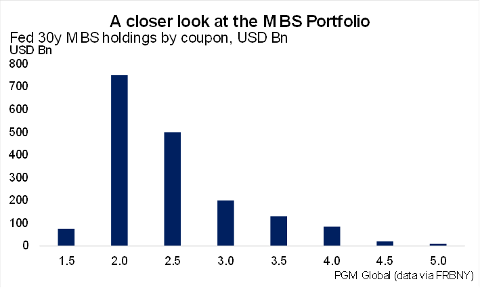
Source: Pavilion Global. As of 4.15.22
The challenge for the Fed in hitting the QT targets without asset sales comes as we note that the prepayments on the 2% and 2.5% 30yr coupons which constitute the bulk of the balance sheet are critically sensitive to any move in rates. Both cohorts have seen their average lives extend dramatically post the estimate and even since the March FOMC meeting. If prepayment speeds fall far enough, asset sales might have to be on the table at some point (in order to meet their plan laid out above regarding QT).
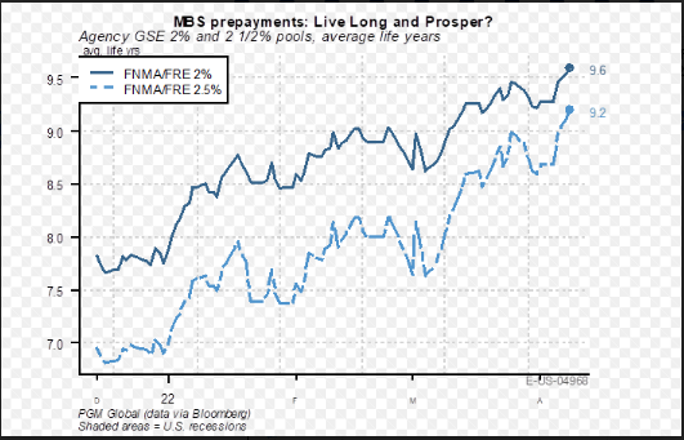
Source: Pavilion Global. As of 4.15.22
Prepayment Speeds
Prepayment speeds are a linear function of the incentive to refinance and correlate with purchase applications, as they imply the sale of a mortgaged property to a new buyer. Black Knight estimates that the universe of loans with an incentive to refinance has fallen 80% since the beginning of the 2021. Meanwhile, the purchase index is holding steady, suggesting that prepayment speeds portfolio-wide should be somewhere near a bottom… that is if rates stop rising.
Source: Pavilion Global. As of 4.15.22
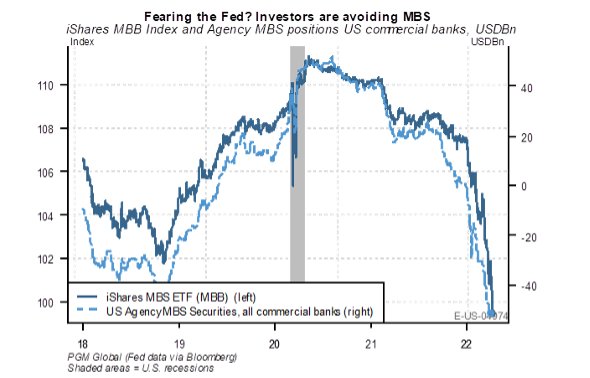
The prospect of central bank asset sales on any meaningful scale is controversial and could be highly problematic for markets. Retail investor demand for MBS has been collapsing as benchmark UST rates explode, and the banks are now backing away following what had been a voracious appetite in 2020.
Agency MBS yields do look more attractive than IG corporates and UST in the context of the Sherman ratio (Yield/duration). Still, that spread advantage is compressing as the MBS durations extend. The Fed must be mindful of the capacity of private markets to absorb MBS supply. We think legitimate concerns around market depth fostered by the prospect of outright asset sales are credible if the prepayment flows continue to drastically slow leading to slower QT than the Fed’s tightening plans displayed.
Disclosures
Past performance is not indicative of future results. This material is not financial advice or an offer to sell any product. The information contained herein should not be considered a recommendation to purchase or sell any particular security. Forward looking statements cannot be guaranteed.
This commentary offers generalized research, not personalized investment advice. It is for informational purposes only and does not constitute a complete description of our investment services or performance. Nothing in this commentary should be interpreted to state or imply that past results are an indication of future investment returns. All investments involve risk and unless otherwise stated, are not guaranteed. Be sure to consult with an investment & tax professional before implementing any investment strategy. Investing involves risk. Principal loss is possible.
The 10 Year Treasury Rate is the yield received for investing in a US government issued treasury security that has a maturity of 10 year. The 10 year treasury yield is included on the longer end of the yield curve. Many analysts will use the 10 year yield as the “risk free” rate when valuing the markets or an individual security.
A mortgage-backed security (MBS) is an investment similar to a bond that is made up of a bundle of home loans bought from the banks that issued them.
The iShares MBS ETF (MBB) seeks to track the investment results of an index composed of investment-grade mortgage-backed pass-through securities issued and/or guaranteed by U.S. government agencies.
Advisory services offered through Aptus Capital Advisors, LLC, a Registered Investment Adviser registered with the Securities and Exchange Commission. Registration does not imply a certain level or skill or training. More information about the advisor, its investment strategies and objectives, is included in the firm’s Form ADV Part 2, which can be obtained, at no charge, by calling (251) 517-7198. Aptus Capital Advisors, LLC is headquartered in Fairhope, Alabama. ACA-2204-33.
