
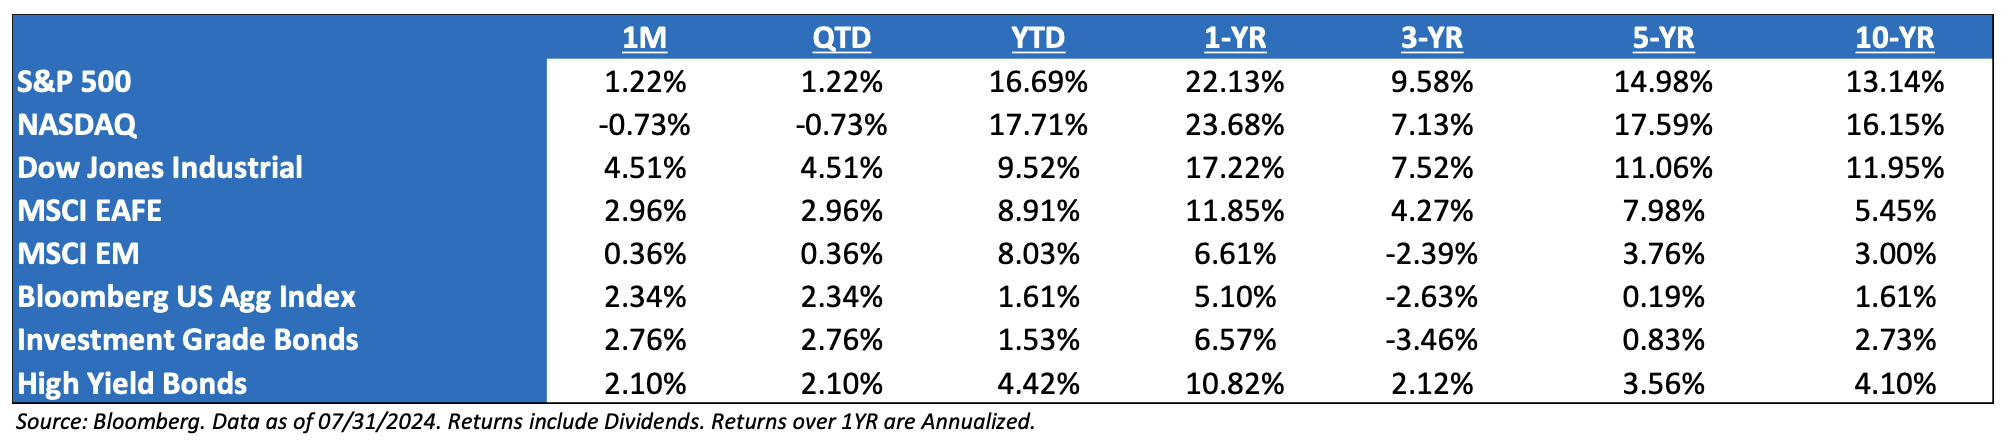
July ‘24 Market Recap + Some August: Political fireworks and a dramatic rotation from large to small cap dominated the headlines over the past month. But, more recently to start August, the market went from “soft landing” to “late cycle” very quickly:
-
- Earnings: Earnings very mixed, not universally bad, but more signs of weakness than in any other quarter since Covid,
- Magnificent Seven: Cloud vendors seem caught in an AI game theory trap. Completely unknown ROI, but the risk to underbuilding is huge if this is a huge long-term market, and the risk of overbuilding is limited given their balance sheets.
- The Fed: Now market is starting to take more seriously that the Fed has over-stayed their welcome and waited too long to lower rates (for International and US economies) – haven’t really had the “recession” narrative since early 2024, but seems to be creeping back into the market.
- Seasonality: We are entering a tough seasonal period for equities (August usually pretty flattish, then September and early October the weakest periods of the year.)
Small Cuts Can Make a Difference: Central bank policy rates can fall sharply in a recession (with large cuts occurring even inter-meeting). But that’s not the current base case. The goal now is to get from a restrictive to a neutral policy – smaller rate cuts may actually be preferable, if that means there’s no emergency. The current outlook for rate cuts looks more like a mid-cycle adjustment vs. the panic of a recession. With numerous central banks having cut rates and others (e.g., the U.K.) likely close, there are already some green shoots developing in global demand. There’s evidence that even small rate cuts (and the anticipation of such policy when it comes to the Fed) can matter. In fact, they may be desirable (e.g., Fed policy in 1995).
Small vs. Nasdaq Performance: On July 10, the Nasdaq was +23% YTD and the Russell was +1%, a 22% spread in favor of the Nasdaq. In the following 11 trading days, boosted by the CPI print on July 11, the Russell has outperformed the Nasdaq by 19%. That’s a 5.5σ move and the largest since 2000. At the end of the month, the R2K was at parity with the NDX on YTD performance. But, as many of us already know, August has had an auspicious start for Small Caps, reversing a lot of this move.
The Caveat to Rate Cuts: The Fed reached its peak overnight rate in July of last year (13 months now), but keep in mind it was stuck for 15 months in 2006/2007 before a slowdown was evident, and ~20 months for job losses to become consistently negative. For those who don’t know, 2006/2007 looked like a soft landing too, for a while. Obviously, the imbalances in the economy are much more benign today than in 2007, but it just goes to show, inflation cooling and rates coming down doesn’t always mean equities just rally endlessly, due to the lagged impact of higher rates on the economy. At some point, earnings may become a bigger fear as the year progresses as the full impact of the rate cycle simply has not yet been felt. But for now, the equity market wants a soft landing, and no obvious reason to fight this trend until earnings trends weaken.
Consumer Continued: There’s about ~$5T in retail savings/money market accounts in the US. Just two years ago, these were earning zero percent. With higher rates, they are now pouring ~$250B annually into the pockets of generally high-income/high-net-worth consumers. So as the low end continues to struggle, the high end has had an offset to higher rates. But we are now lapping peak rates, so YoY, there is no longer an incremental ~$250M YoY entering the economy from higher interest income (we’re lapping it). We’re not sure if it matters or whether this will mean more of the rate hikes will show up in slowing at the macro level, but it’s clearly been one of the reasons the economy has been more resilient than typical to higher rates. By the way, that’s ~1.5% of consumer spending annually.
Gotta Mention Politics → Joe Biden Bows Out: History tells an unfortunate tale of VPs running for the presidency when their boss is ending his term. George H W Bush was the first sitting VP to win since Van Buren in 1836 — both following a popular president. Therein lies the tale. In our opinion, sitting VPs lose because they are not viewed as strong enough candidates to win the nomination or, if they do win, they become a vote on the prior president in the general election, a president whom the public has tired of (Nixon ’60, Humphrey ’68) VPs who did win, Nixon and Biden, were four to eight years removed from office. Other VPs became president because the sitting president died and then won – Roosevelt, Coolidge, Truman, and LBJ.
The Presidential Election Year: Since ‘44, the S&P 500 has not declined in a year in which an incumbent president was running for re-election (avg. return of 16%). Stocks have declined in presidential election years, but in each of those cases, it was a year in which there was an open election with no incumbent running (‘60, ‘00, and ‘08). Presidents want to be re-elected and will use whatever policy levers are needed to boost the US economy. In fact, every president who avoided a recession two years before their re-election went on to win the election. And every president who had a recession in the two years before their re-election went on to lose. As of July, the incumbent is no longer running for president, but that doesn’t mean that the tool chest of liquidity will not be utilized to insulate the market, in case volatility shows its unwelcomed face.
S&P 500 EPS: ’25 (Exp.) EPS = $280. ‘24 EPS = $244 (+10.9%). 2023 = $220 (+0.5%). 2022 = $219 (+7.4%). 2021 = $204.*
Valuations: S&P 500 Fwd. P/E (NTM): 21.1x, EAFE: 14.5x, EM: 11.9x, R1V: 16.6x, and R1G: 27.8x. *
*Source: Bloomberg and FactSet, Data as of 07/31/24
Disclosures
Aptus Capital Advisors, LLC is a Registered Investment Advisor (RIA) registered with the Securities and Exchange Commission and is headquartered in Fairhope, Alabama. Registration does not imply a certain level of skill or training. For more information about our firm, or to receive a copy of our disclosure Form ADV and Privacy Policy call (251) 517-7198 or contact us here. Information presented on this site is for educational purposes only and does not intend to make an offer or solicitation for the sale or purchase of any securities.
This commentary offers generalized research, not personalized investment advice. It is for informational purposes only and does not constitute a complete description of our investment services or performance. Nothing in this commentary should be interpreted to state or imply that past results are an indication of future investment returns. All investments involve risk and unless otherwise stated, are not guaranteed. Be sure to consult with an investment & tax professional before implementing any investment strategy.
Past performance is not indicative of future results. This material is not financial advice or an offer to sell any product. The information contained herein should not be considered a recommendation to purchase or sell any particular security. Forward looking statements cannot be guaranteed.
The S&P 500® is widely regarded as the best single gauge of large-cap U.S. equities. There is over USD 11.2 trillion indexed or benchmarked to the index, with indexed assets comprising approximately USD 4.6 trillion of this total. The index includes 500 leading companies and covers approximately 80% of available market capitalization.
The Nasdaq Composite Index measures all Nasdaq domestic and international based common type stocks listed on The Nasdaq Stock Market. To be eligible for inclusion in the Index, the security’s U.S. listing must be exclusively on The Nasdaq Stock Market (unless the security was dually listed on another U.S. market prior to January 1, 2004 and has continuously maintained such listing). The security types eligible for the Index include common stocks, ordinary shares, ADRs, shares of beneficial interest or limited partnership interests and tracking stocks. Security types not included in the Index are closed-end funds, convertible debentures, exchange traded funds, preferred stocks, rights, warrants, units and other derivative securities.
The Dow Jones Industrial Average® (The Dow®), is a price-weighted measure of 30 U.S. blue-chip companies. The index covers all industries except transportation and utilities.
The MSCI EAFE Index is an equity index which captures large and mid-cap representation across 21 Developed Markets countries*around the world, excluding the US and Canada. With 902 constituents, the index covers approximately 85% of the free float-adjusted market capitalization in each country.
The MSCI Emerging Markets Index captures large and mid-cap representation across 26 Emerging Markets (EM) countries*. With 1,387 constituents, the index covers approximately 85% of the free float-adjusted market capitalization in each country.
Investment-grade Bond (or High-grade Bond) are believed to have a lower risk of default and receive higher ratings by the credit rating agencies. These bonds tend to be issued at lower yields than less creditworthy bonds.
Non-investment-grade debt securities (high-yield/junk bonds) may be subject to greater market fluctuations, risk of default or loss of income and principal than higher-rated securities.
Nasdaq-100® includes 100 of the largest domestic and international non-financial companies listed on the Nasdaq Stock Market based on market capitalization.
The Bloomberg Barclays U.S. Aggregate Bond Index is a broad-based benchmark that measures the investment grade, U.S. dollar-denominated, fixed-rate taxable bond market. This includes Treasuries, government-related and corporate securities, mortgage-backed securities, asset-backed securities, and collateralized mortgage-backed securities. ACA-2408-7.