
Developments over the Past Month:
- Monthly Recap: The path of least resistance has been higher in recent weeks, but there are a lot of moving pieces for the market to deal with. 1) Earnings were very strong, but margins continue to be a focus by the market. 2) Some thoughts on supply chain and inflation worries may be starting to peak but corp. commentary flagging it as a more persistent impact. 3) The Fed is expected to announce the start of a tapering, though balance sheets will continue to expand, and financial conditions will remain easy. 4) Democrats are on the verge of a deal regarding more fiscal stimulus that is unlikely to feature higher corp. tax rates, but it may add to inflation worries, given the already large consumer balance sheets.
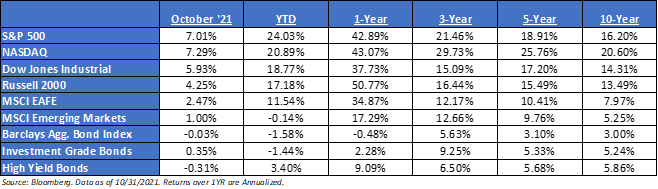
- Where Do We Stand? The S&P 500 just logged its 56th new all-time high for 2021 after 7 straight days of gains. As of October 31st, the S&P 500 has officially recorded a new all-time high in every single month this year – something that has only happened one other time since 1928 (2014). There have been 15 times since 1928, that the S&P is up >20% or more through October. The median return for the rest of the year (last two months only) is +5.92%, with an 80% hit rate. Seasonality also suggests this rally continues into year-end.
- Equity Fundamentals: As equity valuations come under scrutiny amid the rapid rise in real rates, investor focus will increasingly assess whether earnings growth can continue to lead the market higher. As earning’s season winds down, consensus estimates expects S&P 500 EPS growth to decelerate to +27% year/year in Q3. We believe there is upside to consensus estimates but expect the frequency and magnitude of EPS beats will moderate from 1H 2021. There remain four key risks to watch: (1) Supply chains, (2) oil, (3) labor costs, and (4) China growth. Aggregate EPS downside risk from these factors appears relatively contained today.
- The Bond Market Finally Woke Up in September but Was Immaterial in October: The bond market woke up from its slumber, as the 10-YR Treasury yield broke out of its trading range since early July, finishing October at 1.56%. We believe the swoon in bond yields, which also happened last summer, have been more technically driven than fundamentally driven as the Treasury has taken its cash balance from ~$1.7 trillion to ~$300 billion since March. This limiting of new treasury issuance combined with QE and excess bank liquidity has created meaningful artificial demand. The increase in nominal yields created a tough environment for traditional fixed income.
- DC Risks Likely to Take Center Stage Over the Next Few Weeks: DC will start garnering more attention in the coming weeks as the political calculus around passing infrastructure bills and the debt ceiling debate likely guarantees some market moving headlines.
- Debt Ceiling: The can was kicked down the road for the debt ceiling. In late September, the House and Senate were able to pass a short-term budget resolution to keep the government funded until December 3 that includes disaster relief funding and funding for resettlement of Afghans.
- Infrastructure Bill / Reconciliation Package: Speaker Pelosi delinked the reconciliation bill and the bipartisan infrastructure bill, saying that negotiations on the reconciliation bill were not far enough along to continue to pair passage of the bills because the size of the reconciliation package had to come down.
- Taxes: We believe taxes will continue to be a large part of the reconciliation package, as new ideology for corporate taxation have begun to unfold, i.e., minimum corp. tax – not an increase in the statutory tax. Furthermore, the potential addition of buyback surtax has been floated around. As one would expect, this continues to be an evolving matter.
- Q3 Earnings Results: So far, the “important” part of earnings season is essentially over, and the results are better than expected. Companies have cited margin issues and supply chain disruptions, but up to this point management teams have been able to navigate these issues and investors are looking past the disruptions as temporary and are instead focusing on continued strong demand. Put plainly, fears that all of these factors would potentially reduce expected 2022 S&P 500 earnings has not come to fruition. That’s why you’ve seen this market rally to all-time highs, led by the “average stock”, i.e., not MAGA.
- 2019 S&P 500 operating earnings = $165. Bottoms-up for 2020 = $142 (was as low as $125 in June). 2021 = $202
- S&P 500 Fwd. P/E is at 21x. CAPE Ratio is 35x. EAFE is 16x forward P/E, while EM is at 13x. R1V is 17x v. R1G at 31x.
Client Talking Points – November 2021
- President Biden outlined the biggest expansion of the federal government matched with the largest tax increase since 1968. Biden senses the post-COVID era is a once-in-a-generation opportunity to massively restructure US fiscal, monetary, and social policy. In our opinion, this is a big experiment. We’ll wait to see how infrastructure and taxes pan out. It appears that this dramatic change in societal direction has proved to be difficult for some moderate Democrats to get on board with.
- We have expected bond yields to reflate as the pandemic improves and economic activity begins to normalize. The spread on the 2s and 10s has historically expanded as wide as 300 bps (~130bps as of September month-end).
- With the recent Merck Therapeutic news, we believe that this should create an environment of increased optimism surrounding the resumption of normal economic activity, our expectation is that rates will continue to rise, and market leadership will shift away from Tech Growth into more downtrodden components of the market, much like what we saw at the end of September.
- The first half of the year was led by a bunch of one-hit wonders, i.e., most likely not repeatable – a very dovish Fed, a successful economic reopening, and $8T of stimulus. None of which are expected in the second half of the year. The market may have to navigate a slew of negative headlines – increased taxes, higher-than-expected inflation, continued supply bottlenecks, and the possibility of a new Fed Chair. All in all, we believe that this can create an environment of increased volatility.
- We feel it will be worth watching the general trend of economic and fundamental data, and when it will begin to decelerate.
- Longer-term, we believe valuations and bond yields will eventually matter, and both will lower expected returns for balanced portfolios.
Disclosures
Aptus Capital Advisors, LLC is a Registered Investment Advisor (RIA) registered with the Securities and Exchange Commission and is headquartered in Fairhope, Alabama. Registration does not imply a certain level of skill or training. For more information about our firm, or to receive a copy of our disclosure Form ADV and Privacy Policy call (251) 517-7198 or contact us here. Information presented on this site is for educational purposes only and does not intend to make an offer or solicitation for the sale or purchase of any securities.
This commentary offers generalized research, not personalized investment advice. It is for informational purposes only and does not constitute a complete description of our investment services or performance. Nothing in this commentary should be interpreted to state or imply that past results are an indication of future investment returns. All investments involve risk and unless otherwise stated, are not guaranteed. Be sure to consult with an investment & tax professional before implementing any investment strategy.
Past performance is not indicative of future results. This material is not financial advice or an offer to sell any product. The information contained herein should not be considered a recommendation to purchase or sell any particular security. Forward looking statements cannot be guaranteed.
The S&P 500® is widely regarded as the best single gauge of large-cap U.S. equities. There is over USD 11.2 trillion indexed or benchmarked to the index, with indexed assets comprising approximately USD 4.6 trillion of this total. The index includes 500 leading companies and covers approximately 80% of available market capitalization.
The Nasdaq Composite Index measures all Nasdaq domestic and international based common type stocks listed on The Nasdaq Stock Market. To be eligible for inclusion in the Index, the security’s U.S. listing must be exclusively on The Nasdaq Stock Market (unless the security was dually listed on another U.S. market prior to January 1, 2004 and has continuously maintained such listing). The security types eligible for the Index include common stocks, ordinary shares, ADRs, shares of beneficial interest or limited partnership interests and tracking stocks. Security types not included in the Index are closed-end funds, convertible debentures, exchange traded funds, preferred stocks, rights, warrants, units and other derivative securities.
The Dow Jones Industrial Average® (The Dow®), is a price-weighted measure of 30 U.S. blue-chip companies. The index covers all industries except transportation and utilities.
The Russell 2000® Index measures the performance of the small-cap segment of the US equity universe. The Russell 2000® Index is a subset of the Russell 3000® Index representing approximately 10% of the total market capitalization of that index. It includes approximately 2,000 of the smallest securities based on a combination of their market cap and current index membership. The Russell 2000® is constructed to provide a comprehensive and unbiased small-cap barometer and is completely reconstituted annually to ensure larger stocks do not distort the performance and characteristics of the true small-cap opportunity set.
The MSCI EAFE Index is an equity index which captures large and mid-cap representation across 21 Developed Markets countries*around the world, excluding the US and Canada. With 902 constituents, the index covers approximately 85% of the free float-adjusted market capitalization in each country.
The MSCI Emerging Markets Index captures large and mid-cap representation across 26 Emerging Markets (EM) countries*. With 1,387 constituents, the index covers approximately 85% of the free float-adjusted market capitalization in each country.
The Bloomberg Barclays U.S. Aggregate Bond Index is a broad-based benchmark that measures the investment grade, U.S. dollar-denominated, fixed-rate taxable bond market. This includes Treasuries, government-related and corporate securities, mortgage-backed securities, asset-backed securities and collateralized mortgage-backed securities. ACA-2111-3.
