
Higher Rates, Resilient Stocks
+2.30% S&P 500 Q3 Return
-0.35% S&P 500 September Return
31.7% ’26 Estimate S&P 500 Earnings Growth
5.30% 10-Yr Treasury Yield (9/30)
Market Recap – Rates Matter, But So Do Profits
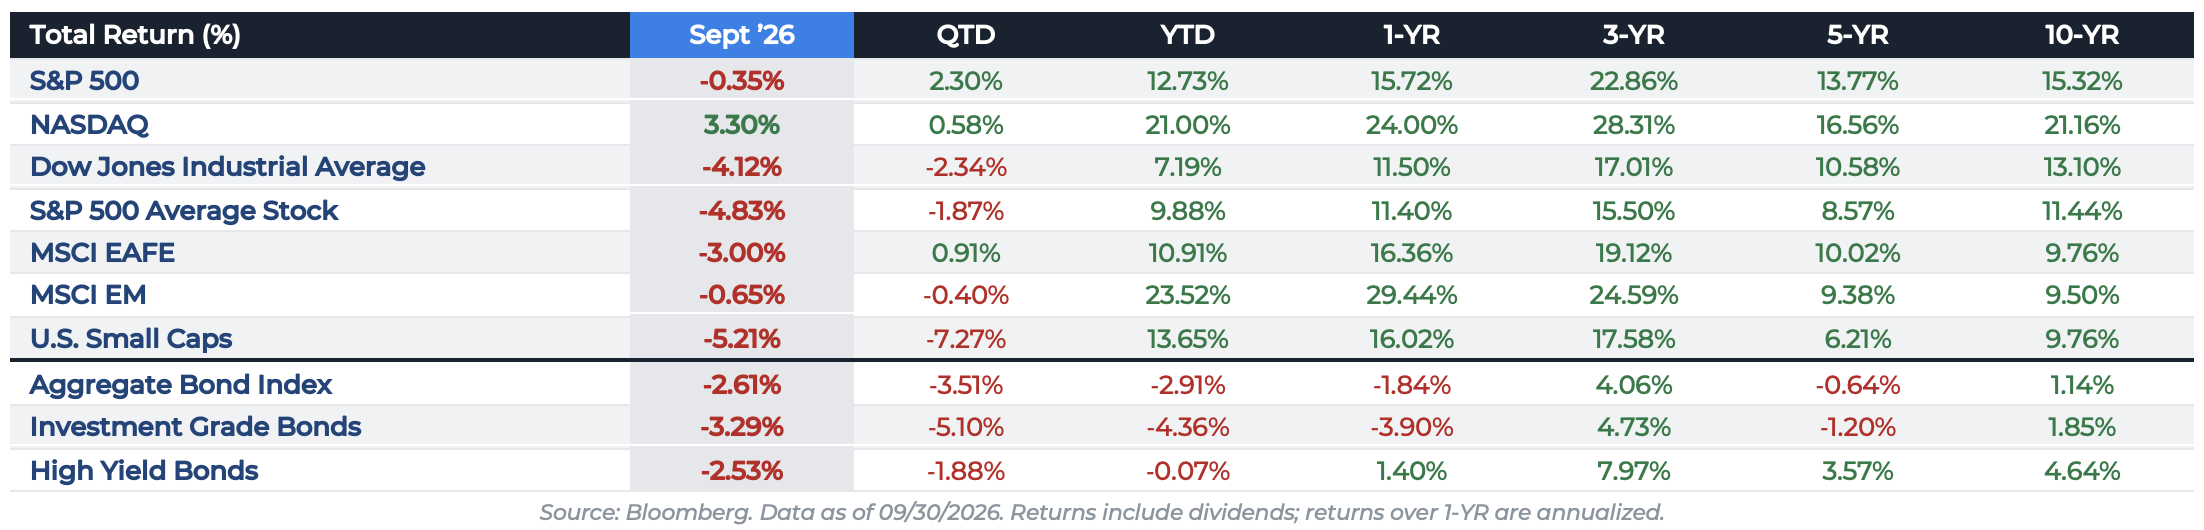
The story of Q3 was rates. The 10-year Treasury broke through 5% in September and closed the quarter at 5.30%, its highest level since 2007, while the 30-year reached 5.7%, a level not seen since 2002. The Fed added fuel with its first hike since 2023. In past cycles, a move like that would have knocked stocks well off their highs. Instead, the S&P 500 finished Q3 up 2.30% (+12.73% YTD) and sits within a few percent of its record; the last time the 10-year touched 5%, in October 2023, the index was roughly 10% below its high. The difference is profits. EPS grew roughly 9% during the quarter while the multiple contracted about 6%, so earnings absorbed the rate shock that valuations couldn’t. Rates did sort the market, though. The Nasdaq Composite rose 3.30% in September as investors crowded into AI leaders with the earnings to back them up, while the average stock fell ‑4.83%, small caps fell ‑5.21%, and bond proxies like Utilities and Real Estate took the worst of it. Higher rates raise the bar, but companies growing their profits can still clear it.
Bond Recap – It’s the Why, Not the Level
The Agg fell ‑2.61% in September and ‑3.51% in Q3, with long duration hit hardest (20+ year Treasuries ‑8.95%). With breakevens anchored near 2.35%-2.40%, this is a growth and term-premium story, not an inflation scare: nominal GDP is running 6%-8%, and heavy issuance is meeting fewer price-insensitive buyers. It’s also global, with every major sovereign 10-year up at least 50bps this year. Speed is what breaks things: past credit events followed ~200bp jumps in 12 months, and we’re about +117bps. Our line: 5% is stress, 6% is credit risk.
Get Back to the Market Basics
Earnings Growth Continues to Trend Higher: ’26 growth stands at 31.7% as Q3 season opens 10/13 with JPM. Analysts raised Q3 estimates mid-quarter instead of the usual ~2% cut, and Q2 crushed a ~23% forecast (52% headline, 32% ex-investment gains).
Profit Growth Remains Strong: Forward margins are at records for both the S&P 500 (21.5%) and the equal-weight index (15.2%), so efficiency gains are spreading beyond mega-cap tech.
Why Has the Market Remained So Resilient?
Monetary: The Fed hiked 25bps to 3.75%-4.00%, but 2025’s cuts are still transmitting and real rates remain low. One hike doesn’t make policy tight.
Fiscal: The deficit is near 6% of GDP at full employment, and OBBB’s 100% expensing keeps rewarding capex.
Private: AI capex is on pace for ~$730B in 2026 and $1T+ in 2027, and it’s showing up in revenue (Q2 cloud growth: 48%).
It’s Not the First Hike That Kills the Market
The first hike is rarely the one to fear: in 1987 it was the third, in 2000 the fifth. After the eight first hikes since 1983, the S&P 500 averaged +5.7% over six months, though the first three months have been negative in every cycle since 1994. What matters is long rates. When they stayed contained (2004, 2016), stocks rose 15%-17% the next year; when the 10-year surged (1987, 2022), stocks fell ~10%. Today’s +116bp YTD move is well short of the 240-300bp surges that preceded the 1987 and 2000 tops.
No Hire, No Fire, Average Growth Economy
Rising yields don’t mean the economy is overheating: oil near $100, not excess demand, explains most of the pickup in inflation, and wage growth (3.1%) trails prices. With low birth rates and little immigration, few new workers are entering the labor force, so weak payrolls and low jobless claims are two sides of the same coin. A soft September print says more about forecasts than the economy. With unemployment at 4.1%, this is mid-cycle.
$100 Oil Isn’t the $100 Oil of 2008
Adjusted for inflation, crude averaged $149 in 1980 and $138 in 2008. Gasoline took under 2% of disposable income in 2025, the lowest share in two decades, versus 5.3% in 2008. And with record production of 13.8M barrels a day, the U.S. is now a net petroleum exporter, so a price spike recycles income to domestic producers instead of shipping it overseas. It stings, but far less than it used to.
The Consumer’s Balance Sheet Has Never Looked Stronger
Household net worth jumped $12.8T in Q2 to a record $195.9T. Household stock holdings are up 143% since COVID; liabilities rose just 32%. Liabilities now equal only 10.3% of assets, the lowest since 1962, and the bottom 50% has posted the fastest percentage gain in net worth since 2019 (+129%). A consumer this under-levered isn’t one on the verge of retrenching, as long as the labor market holds.
Moving Forward – Remain Optimistic
As long as earnings grow, the burden of proof stays with the bears. Equities can absorb growth-driven yields; the real risk is a disorderly spike in long rates. Seasonality helps from here: Q4 is the strongest quarter of the midterm year (+6.6% average), and stocks have been higher 12 months after every midterm since 1938. We’re still in a bull market. Don’t fight it, don’t chase it, and treat volatility as an opportunity.

Disclosures
Aptus Capital Advisors, LLC is a Registered Investment Advisor (RIA) registered with the Securities and Exchange Commission and is headquartered in Fairhope, Alabama. Registration does not imply a certain level of skill or training. For more information about our firm, or to receive a copy of our disclosure Form ADV and Privacy Policy call (251) 517-7198. Information presented on this site is for educational purposes only and does not intend to make an offer or solicitation for the sale or purchase of any securities.
This commentary offers generalized research, not personalized investment advice. It is for informational purposes only and does not constitute a complete description of our investment services or performance. Nothing in this commentary should be interpreted to state or imply that past results are an indication of future investment returns. All investments involve risk and unless otherwise stated, are not guaranteed. Be sure to consult with an investment & tax professional before implementing any investment strategy.
Past performance is not indicative of future results. This material is not financial advice or an offer to sell any product. The information contained herein should not be considered a recommendation to purchase or sell any particular security. Forward looking statements cannot be guaranteed.
Forward price-to-earnings (P/E) (NTM) is a valuation metric dividing a stock’s current price by its projected earnings per share over the next twelve months. It measures how expensive a stock is relative to its expected near-term profitability.
The S&P 500® is widely regarded as the best single gauge of large-cap U.S. equities. There is over USD 11.2 trillion indexed or benchmarked to the index, with indexed assets comprising approximately USD 4.6 trillion of this total. The index includes 500 leading companies and covers approximately 80% of available market capitalization.
The Nasdaq Composite Index measures all Nasdaq domestic and international based common type stocks listed on The Nasdaq Stock Market. To be eligible for inclusion in the Index, the security’s U.S. listing must be exclusively on The Nasdaq Stock Market (unless the security was dually listed on another U.S. market prior to January 1, 2004 and has continuously maintained such listing). The security types eligible for the Index include common stocks, ordinary shares, ADRs, shares of beneficial interest or limited partnership interests and tracking stocks. Security types not included in the Index are closed-end funds, convertible debentures, exchange traded funds, preferred stocks, rights, warrants, units and other derivative securities.
The Dow Jones Industrial Average® (The Dow®), is a price-weighted measure of 30 U.S. blue-chip companies. The index covers all industries except transportation and utilities.
The S&P 500® Equal Weight Index holds the same constituents as the S&P 500® but assigns each company an equal weight at each quarterly rebalance rather than weighting by market capitalization. References in this commentary to the “average stock” or the “equal-weight index” refer to this index.
The MSCI EAFE Index is an equity index which captures large and mid-cap representation across 21 Developed Markets countries*around the world, excluding the US and Canada. With 902 constituents, the index covers approximately 85% of the free float-adjusted market capitalization in each country.
The MSCI Emerging Markets Index captures large and mid-cap representation across 26 Emerging Markets (EM) countries*. With 1,387 constituents, the index covers approximately 85% of the free float-adjusted market capitalization in each country.
The Russell 2000® Index measures the performance of the small-cap segment of the U.S. equity market. It is composed of approximately 2,000 of the smallest companies in the Russell 3000® Index and is reconstituted annually. References in this commentary to “small caps” refer to this index.
The Bloomberg U.S. Aggregate Bond Index is a broad-based benchmark that measures the investment grade, U.S. dollar-denominated, fixed-rate taxable bond market. This includes Treasuries, government-related and corporate securities, mortgage-backed securities, asset-backed securities, and collateralized mortgage-backed securities.
The Bloomberg U.S. Corporate Bond Index tracks U.S. dollar-denominated, investment grade, fixed-rate, taxable corporate bonds publicly issued by industrial, utility and financial companies, both U.S. and non-U.S. domiciled. Investment-grade bonds are believed to have a lower risk of default and receive higher ratings from the credit rating agencies; they tend to be issued at lower yields than less creditworthy bonds.
The Bloomberg U.S. Corporate High Yield Bond Index tracks U.S. dollar-denominated, fixed-rate corporate bonds rated below investment grade (Ba1/BB+ or lower, based on the middle rating of Moody’s, S&P and Fitch). Non-investment-grade debt securities (high-yield/junk bonds) may be subject to greater market fluctuations, risk of default or loss of income and principal than higher-rated securities.
The Bloomberg U.S. Treasury 20+ Year Index measures U.S. dollar-denominated, fixed-rate, nominal debt issued by the U.S. Treasury with 20 or more years remaining to maturity. References in this commentary to “20+ year Treasuries” refer to this index. ACA-2610-4.