
Market Recap – Earnings Growth Was the Star in August: August 2026 opened with real momentum and closed under a shadow of caution. The S&P 500 pushed to an all-time closing high above 7,800 around mid-month, capping a 2.7% gain for the month, as cooler-than-expected CPI and PPI data reinforced the case for the Fed holding rates steady. Corporate earnings did the heavy lifting from there, with strong beats on both revenue and margins keeping the rally intact – and breadth improved too, as the Russell 2000 hit a fresh record high while the Nasdaq 100 led with a 4.4% gain on continued AI-driven earnings strength. The tone shifted late in the month, though, as rising oil prices tied to Middle East tensions pushed bond yields higher and pressured sentiment, clipping some gains off the highs by month-end.
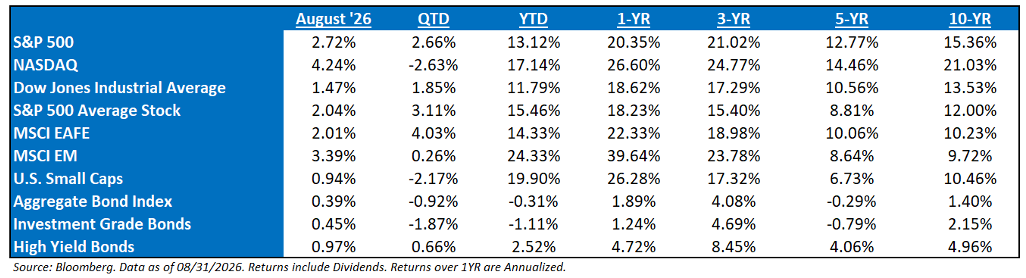
Bond Recap: Bonds spent most of August in a holding pattern before getting jolted late in the month. Cooler-than-expected CPI and PPI prints early on kept yields relatively contained, as the data reinforced expectations that the Fed would hold rates steady rather than resume tightening – a backdrop that generally favored duration and kept credit markets calm. That changed in the back half of the month, as rising oil prices tied to escalating Middle East tensions pushed yields higher, with the move rippling across the curve as inflation concerns crept back into the conversation. The result was a give-back of some of the earlier calm, with fixed income ending the month on a more cautious footing than it started, mirroring the same late-month pressure that hit equities.
Aptus’ Phrase of the Year – Get Back to the Market Basics: When markets feel like they’re chaotic, focus on the basics, which are very simple:
Earnings Growth Continues to Trend Higher: With Q2 earnings season now finished, the fundamental backdrop for equities remains supportive. As of the end of August, the ‘26 earnings growth stands at 31.5%. If there’s one area of fundamental risk, it’s the continued concentration within the index – it can drive markets higher or lower. For now, though, growth remains robust due to the strong operating leverage from those exact mega-caps.
Profit Growth Remains Strong: Simply said, when economic profitability is increasing or staying stagnant, historically it’s been difficult for the market to get into trouble. Not only is the market-cap weighted index, the S&P 500, witnessing operating margin expansion, but the average stock has also seen growth.
Why Has the Market Remained So Resilient? Three separate forms of economic stimuli are hitting the economy and markets: Combining these factors increases expectations for economic growth and corporate earnings sustainability.
Monetary stimulus conditions remain expansionary because real rates are still low relative to trend growth, and liquidity in the system hasn’t meaningfully tightened. A hike or two likely won’t flip policy into restrictive territory – the starting point is accommodative enough that it would take a more sustained tightening cycle to get there.
Fiscal stimulus remains expansionary because the deficit is running above 6% of GDP, pumping demand into an economy that’s already at full employment. With no spare labor capacity to soak up that extra demand, the result is upward pressure on prices rather than additional real output.
Private stimulus, meanwhile, is occurring through massive AI-linked capital expenditures from major tech companies such as META, MSFT, AMZN, ORCL and others (remember, these mega-cap tech firms could spend more than $950B on AI infrastructure in 2027).
The Kevin Warsh “Reaction Function”: Everyone wants Warsh’s “reaction function” – the rule (mathematical like Taylor’s, or gut-driven like Greenspan’s) that, combined with a forecast, becomes forward guidance. Some Fed Governors even want the Fed to publish it outright. But whose rule is the important question? Kevin Warsh just took three dissents and called the split a “design feature” – meaning there’s no shared rule across 12 voters; there are 12 different ones. Before Warsh can give us his function, he needs a metric behind it. And even then, 11 more voters remain a mystery on their respective reaction function. Markets have gotten spoon-fed the Fed’s rules instead of reasoning it out themselves – a dependency that cuts both ways. If you can call the Fed’s next move correctly, that’s where the real money is made and is called free market capitalism.
Enter Mid-Term Elections into the Market: Post-Labor Day in mid-term election years tends to be choppy – September/October see below-average returns and elevated volatility as markets digest election uncertainty and policy gridlock risk. But once the outcome is known, equities have historically rallied into year-end, with Q4 being one of the seasonally strongest stretches. Net effect: a rough patch followed by a fairly reliable bounce – though it’s a historical tendency based on a limited sample, not a guarantee. A likely wrinkle this cycle: data centers are becoming politically charged (power/water use, permitting fights, AI-sovereignty rhetoric), adding a new source of headline risk heading into the midterms. The real test is whether that noise actually shows up in hyperscaler capex guidance. Worth watching earnings commentary this fall for any hedging on data center timelines – that’s the difference between political noise and an actual dent to growth rates.
Moving Forward, Investors Need to Remain Optimistic: As long as earnings are growing, which they are, and as long as both monetary and fiscal policy are on the market’s side, the burden of proof will remain with the bears. We are still in a bull market – don’t fight it – but that doesn’t mean chase it or sell if there is weakness. It appears that the market is entering a period where it can see a moderation of the hard economic data, but not enough to warrant a recession. Meanwhile, forward-looking sentiment data should continue to improve as economic tail risks diminish and expansionary fiscal policy is on the horizon. This, combined with ongoing AI-driven investment and innovation, should continue to support risk assets once we move beyond the current geopolitical tensions.
S&P 500 EPS: ’28 (Exp.) EPS = $479.90 (+15.6%). ’27 (Exp.) EPS = $415.07 (+14.9%). ’26 (Exp.) EPS = $361.33 (+31.5%). ’25 (Exp.) EPS = $274.54 (+12.0%).
Valuations: S&P 500 Fwd. P/E (NTM): 19.5x, NASDAQ: 21.3x, EAFE: 15.6x, EM: 9.9x, R1V: 17.9x, and R1G: 21.8x. *
*Source: Bloomberg and FactSet, Data as of 08/31/26
Disclosures
Aptus Capital Advisors, LLC is a Registered Investment Advisor (RIA) registered with the Securities and Exchange Commission and is headquartered in Fairhope, Alabama. Registration does not imply a certain level of skill or training. For more information about our firm, or to receive a copy of our disclosure Form ADV and Privacy Policy call (251) 517-7198 or contact us here. Information presented on this site is for educational purposes only and does not intend to make an offer or solicitation for the sale or purchase of any securities.
This commentary offers generalized research, not personalized investment advice. It is for informational purposes only and does not constitute a complete description of our investment services or performance. Nothing in this commentary should be interpreted to state or imply that past results are an indication of future investment returns. All investments involve risk and unless otherwise stated, are not guaranteed. Be sure to consult with an investment & tax professional before implementing any investment strategy.
Past performance is not indicative of future results. This material is not financial advice or an offer to sell any product. The information contained herein should not be considered a recommendation to purchase or sell any particular security. Forward looking statements cannot be guaranteed.
The S&P 500® is widely regarded as the best single gauge of large-cap U.S. equities. There is over USD 11.2 trillion indexed or benchmarked to the index, with indexed assets comprising approximately USD 4.6 trillion of this total. The index includes 500 leading companies and covers approximately 80% of available market capitalization.
The Nasdaq Composite Index measures all Nasdaq domestic and international based common type stocks listed on The Nasdaq Stock Market. To be eligible for inclusion in the Index, the security’s U.S. listing must be exclusively on The Nasdaq Stock Market (unless the security was dually listed on another U.S. market prior to January 1, 2004 and has continuously maintained such listing). The security types eligible for the Index include common stocks, ordinary shares, ADRs, shares of beneficial interest or limited partnership interests and tracking stocks. Security types not included in the Index are closed-end funds, convertible debentures, exchange traded funds, preferred stocks, rights, warrants, units and other derivative securities.
The Dow Jones Industrial Average® (The Dow®), is a price-weighted measure of 30 U.S. blue-chip companies. The index covers all industries except transportation and utilities.
The MSCI EAFE Index is an equity index which captures large and mid-cap representation across 21 Developed Markets countries*around the world, excluding the US and Canada. With 902 constituents, the index covers approximately 85% of the free float-adjusted market capitalization in each country.
The MSCI Emerging Markets Index captures large and mid-cap representation across 26 Emerging Markets (EM) countries*. With 1,387 constituents, the index covers approximately 85% of the free float-adjusted market capitalization in each country.
Investment-grade Bond (or High-grade Bond) are believed to have a lower risk of default and receive higher ratings by the credit rating agencies. These bonds tend to be issued at lower yields than less creditworthy bonds.
Non-investment-grade debt securities (high-yield/junk bonds) may be subject to greater market fluctuations, risk of default or loss of income and principal than higher-rated securities.
Nasdaq-100® includes 100 of the largest domestic and international non-financial companies listed on the Nasdaq Stock Market based on market capitalization.
The Bloomberg Barclays U.S. Aggregate Bond Index is a broad-based benchmark that measures the investment grade, U.S. dollar-denominated, fixed-rate taxable bond market. This includes Treasuries, government-related and corporate securities, mortgage-backed securities, asset-backed securities, and collateralized mortgage-backed securities. ACA-2609-6.