
Our team looks at a lot of research throughout the day. Here are a handful of charts we think are good summations of investor activity, from the money growth behind record earnings and a productivity breakout, to an AI buildout bigger than the railroads, its funding getting tighter just as the tech trade gets cheaper, value and real yields re-rating, a round trip in long Treasuries, a housing market feeling the rate pain, the options boom underneath it all, and a closing reminder of how little any of us can forecast. Have a great weekend!
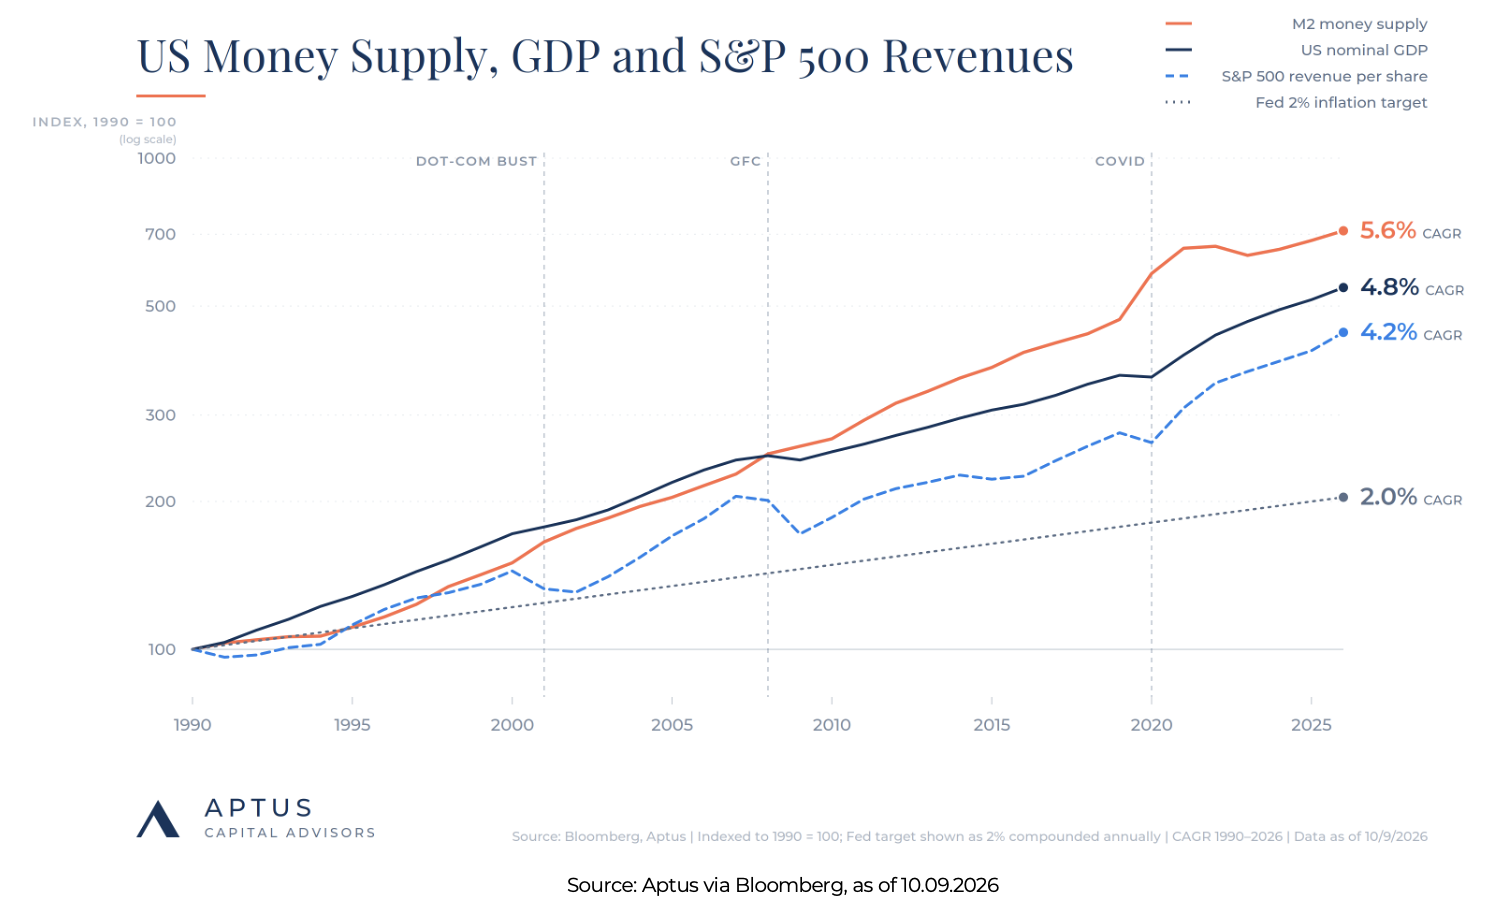
JD: Money supply has grown 5.6% a year since 1990, well ahead of the Fed’s 2% inflation target and even ahead of GDP and corporate revenues.
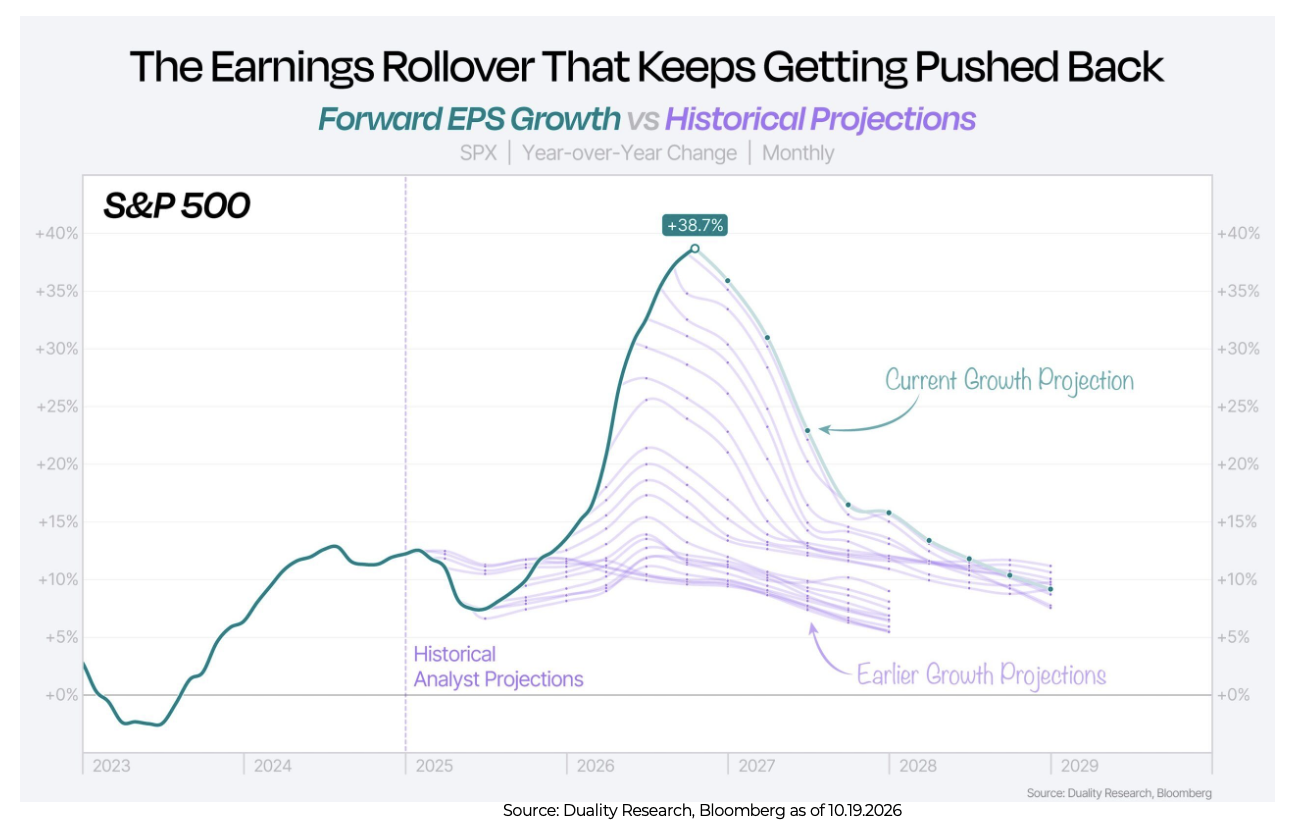
Beckham: That revenue is showing up on the bottom line. Forward EPS growth for the S&P 500 is running at 38.7% year-over-year, and projected growth has been consistently pushed out since early 2025.
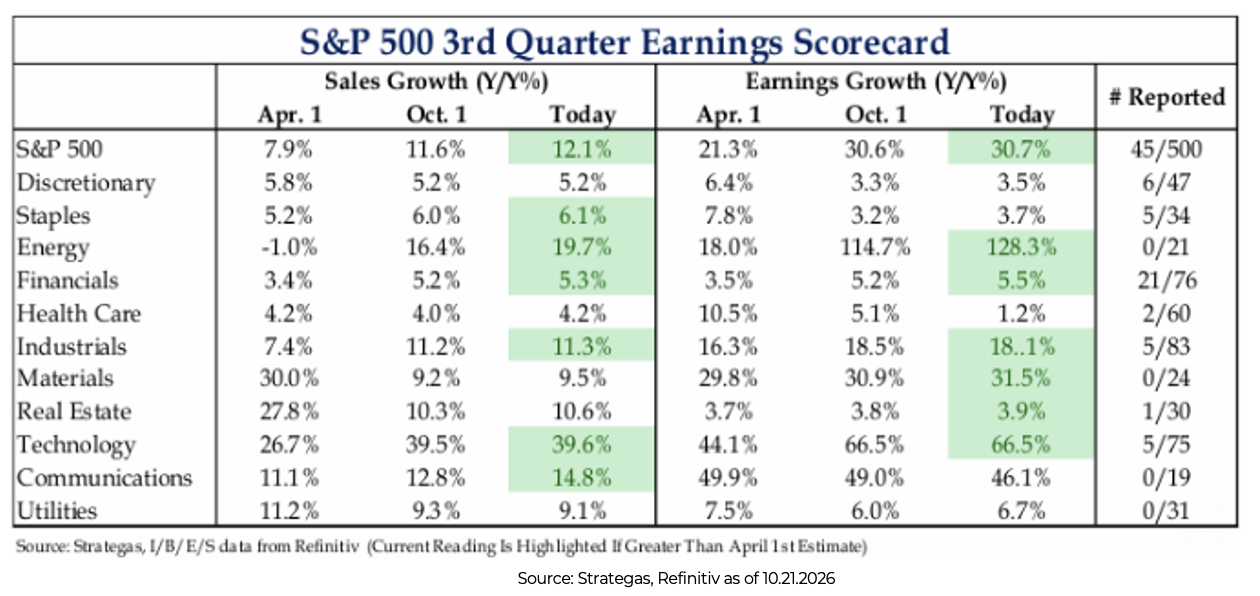
Mark: The Q3 scorecard has S&P 500 earnings growth tracking 30.7% with 45 of 500 companies reported, up from a 21.3% estimate in April. Technology is carrying it at 66.5% earnings growth on sales up 39.6%.
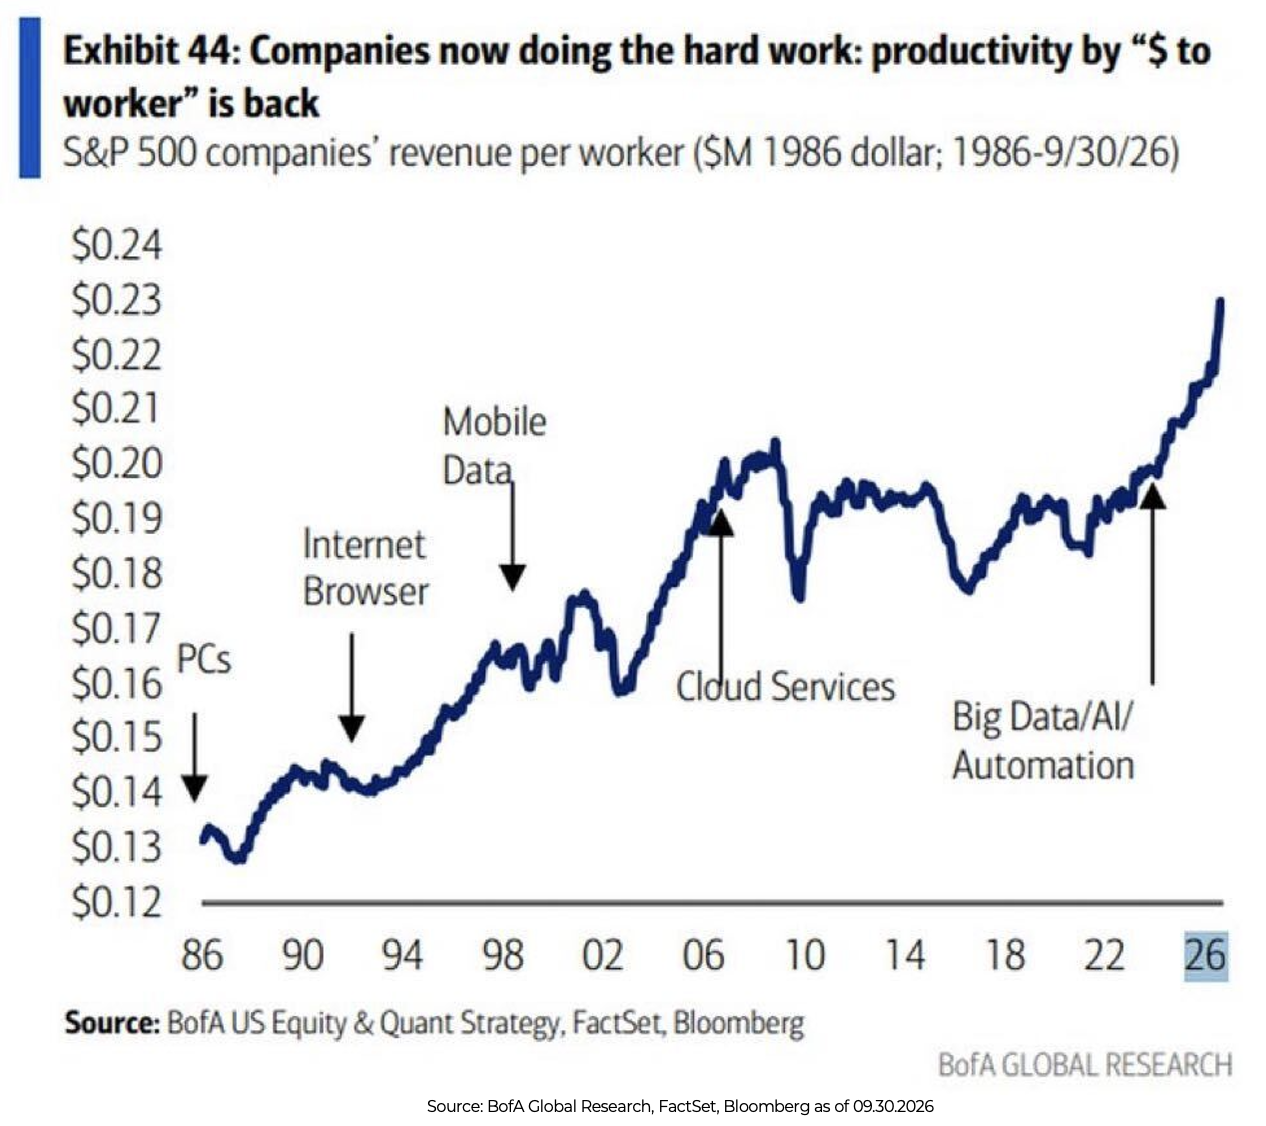
Dave: Revenue per worker at S&P 500 companies just hit a record $230,000 in 1986 dollars after nearly two decades flat near $190,000. The breakout lines up with the AI and automation spend.
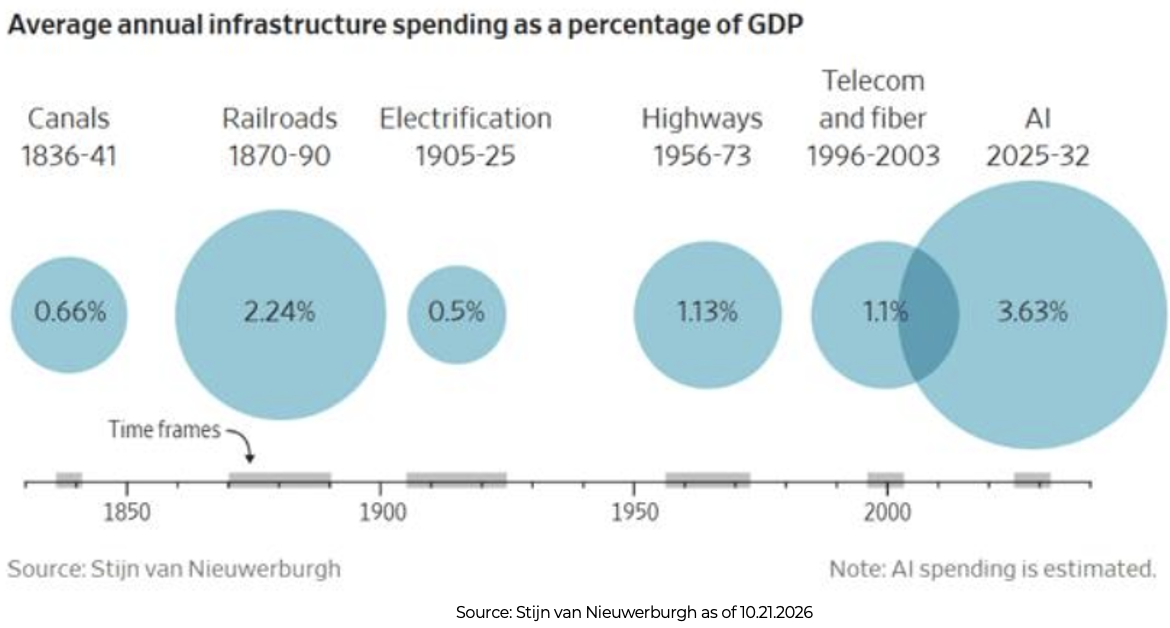
John: AI infrastructure spending is running at an estimated 3.63% of GDP a year from 2025 to 2032. That is more than the railroads at 2.24% and more than canals, electrification, highways, and fiber combined.
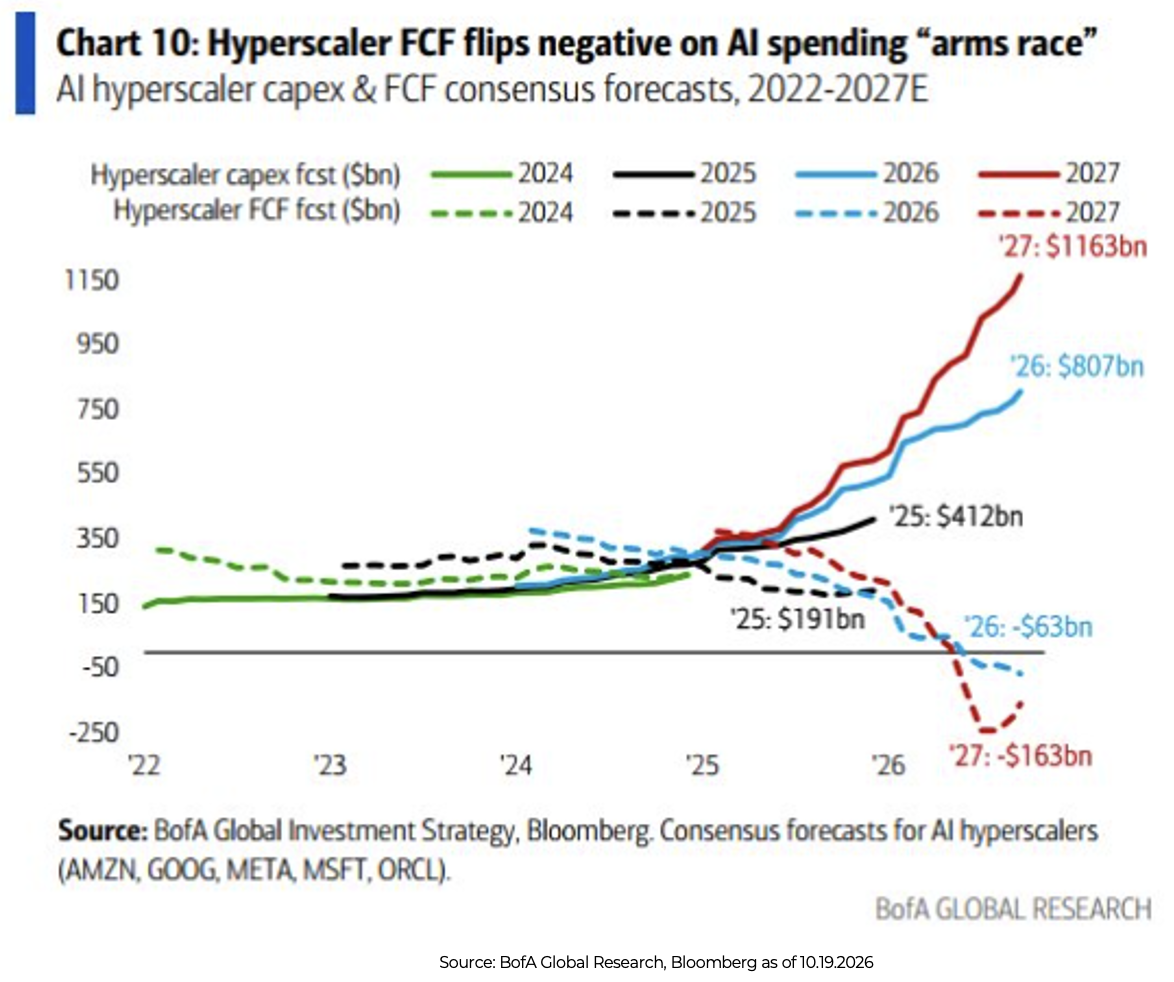
Brad: Hyperscalers are fueling a lot of the economic growth and earnings among technology hardware companies, but free cash flow is expected to turn negative in 2026 and get worse next year, as AI capex heads past $1T. Meanwhile, semis prices hit 20-year highs and credit conditions tightened, most visibly in Oracle’s surging CDS. Oracle’s 5Y CDS has gone from ~50bp to ~280bp in a year, and IG tech spreads are widening with it. The AI buildout was supposed to be self-funding. It isn’t anymore.
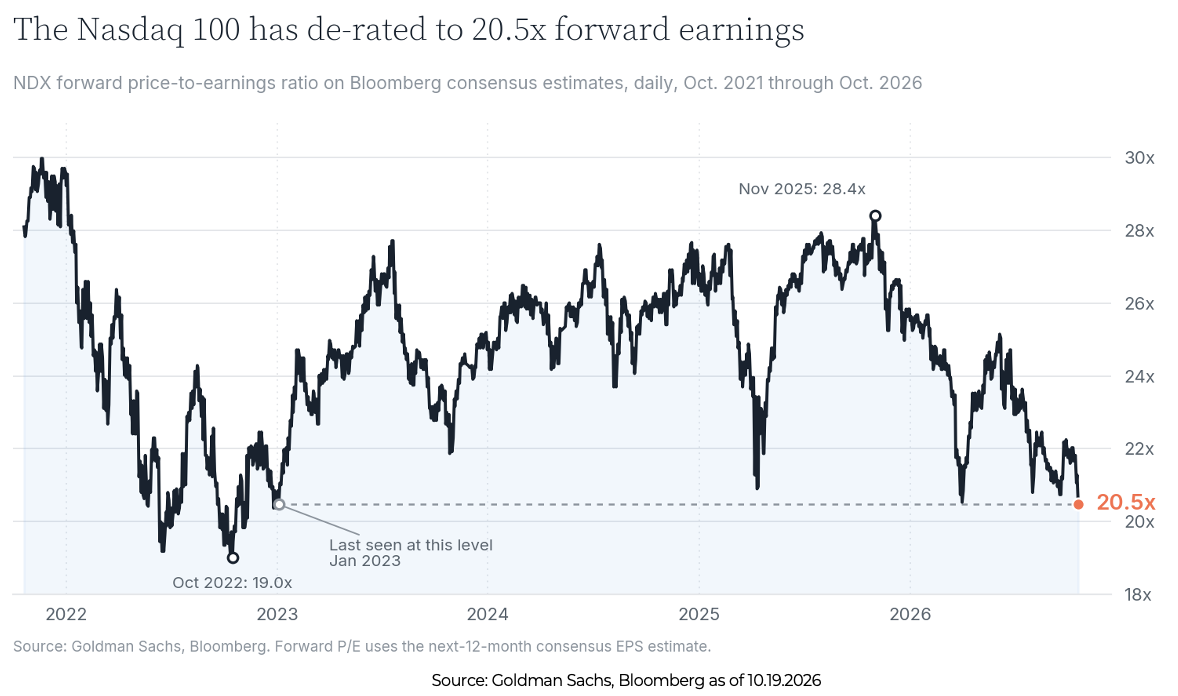
Joseph: Semis have led the way down, from 29x forward earnings this summer to 17x today. That leaves the Nasdaq 100 at 20.5x, its lowest multiple since the AI cycle began in 2023 and only a 1.8x premium to the S&P 500.
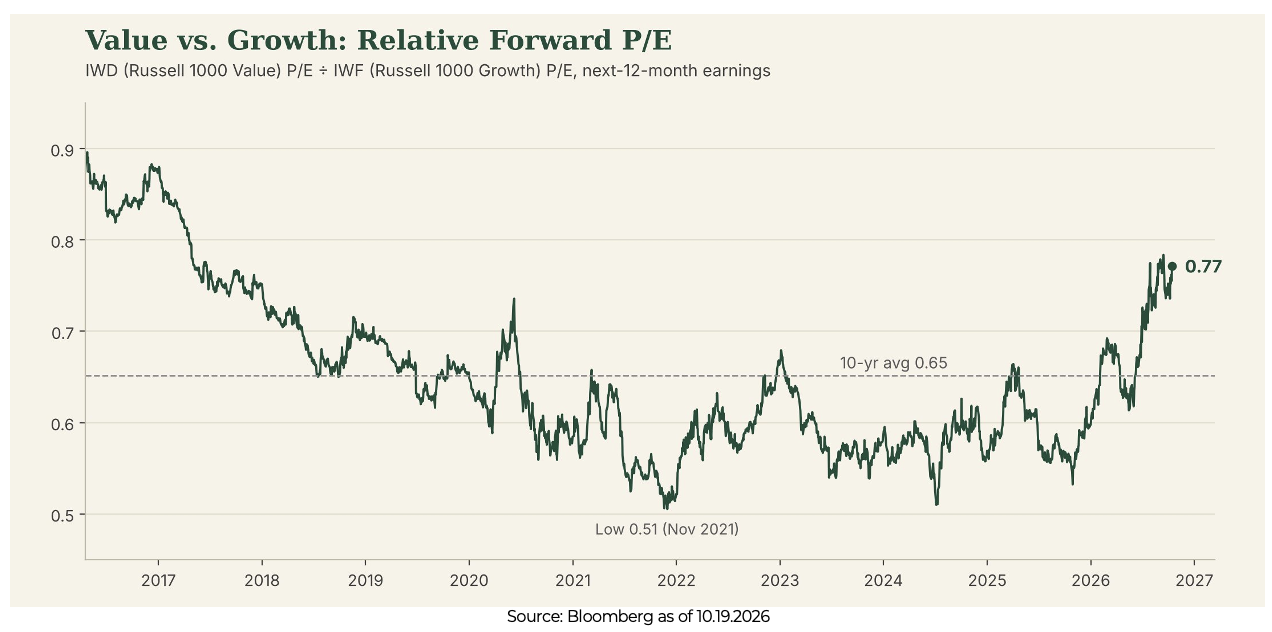
Derek: That leaves value at 0.77x growth’s forward P/E. It is the highest relative level since 2017 and well above the 10-year average of 0.65.
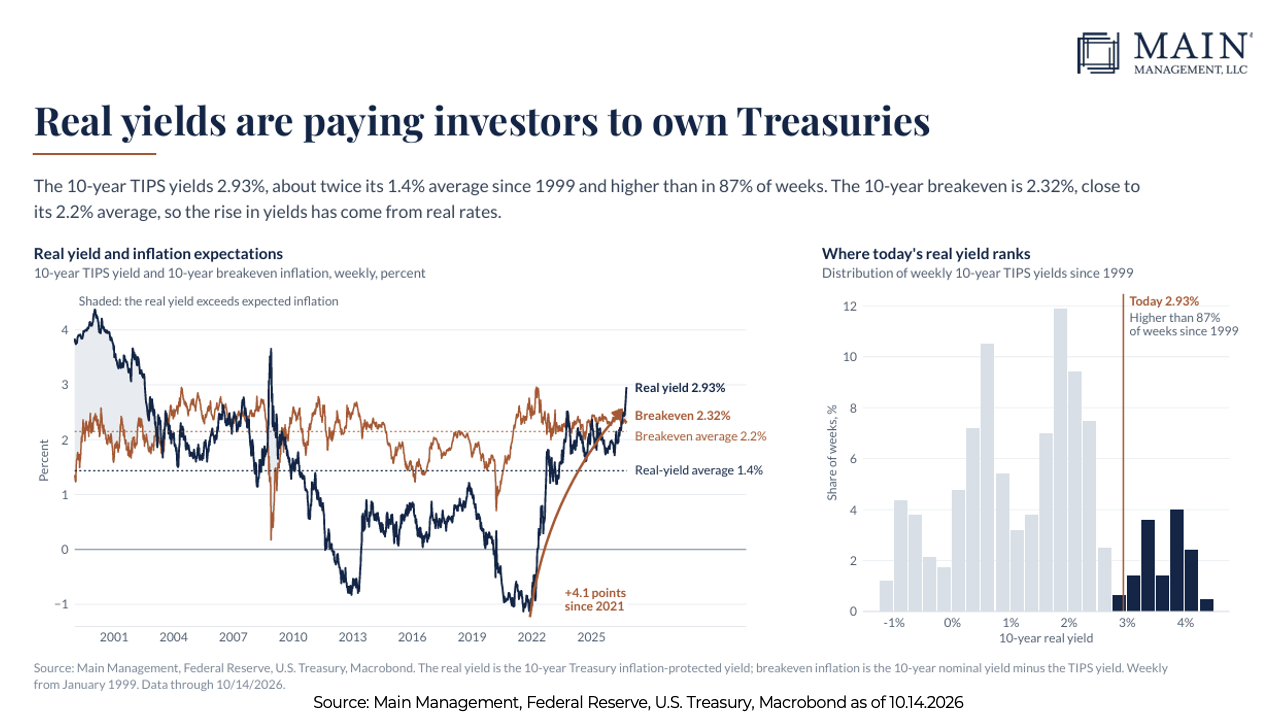
John Luke: The 10-year real yield is 2.93%, about twice its 1.4% average since 1999 and higher than in 87% of weeks since then. Breakevens are still 2.32%, so the move is coming from real rates rather than inflation expectations.
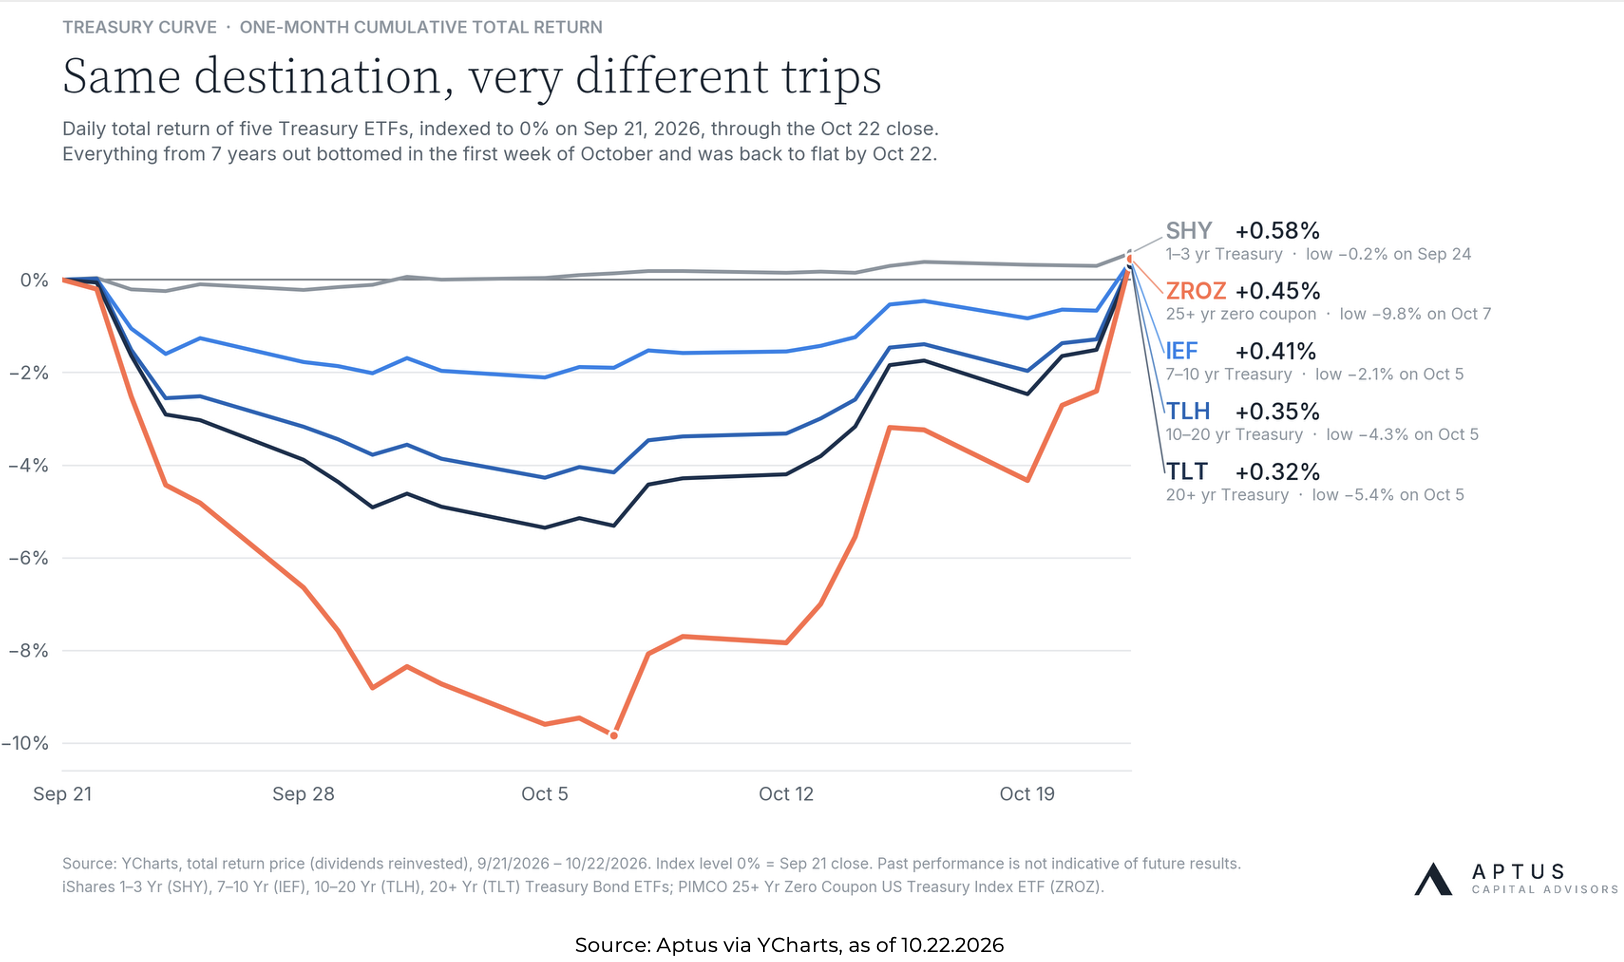
Jake: It has been a wild month to get nowhere in Treasuries. Long zero-coupon bonds were down 9.8% at the October 7 low, and 20+ year Treasuries down 5.4%, yet every maturity has clawed its way back to finish the month slightly positive.
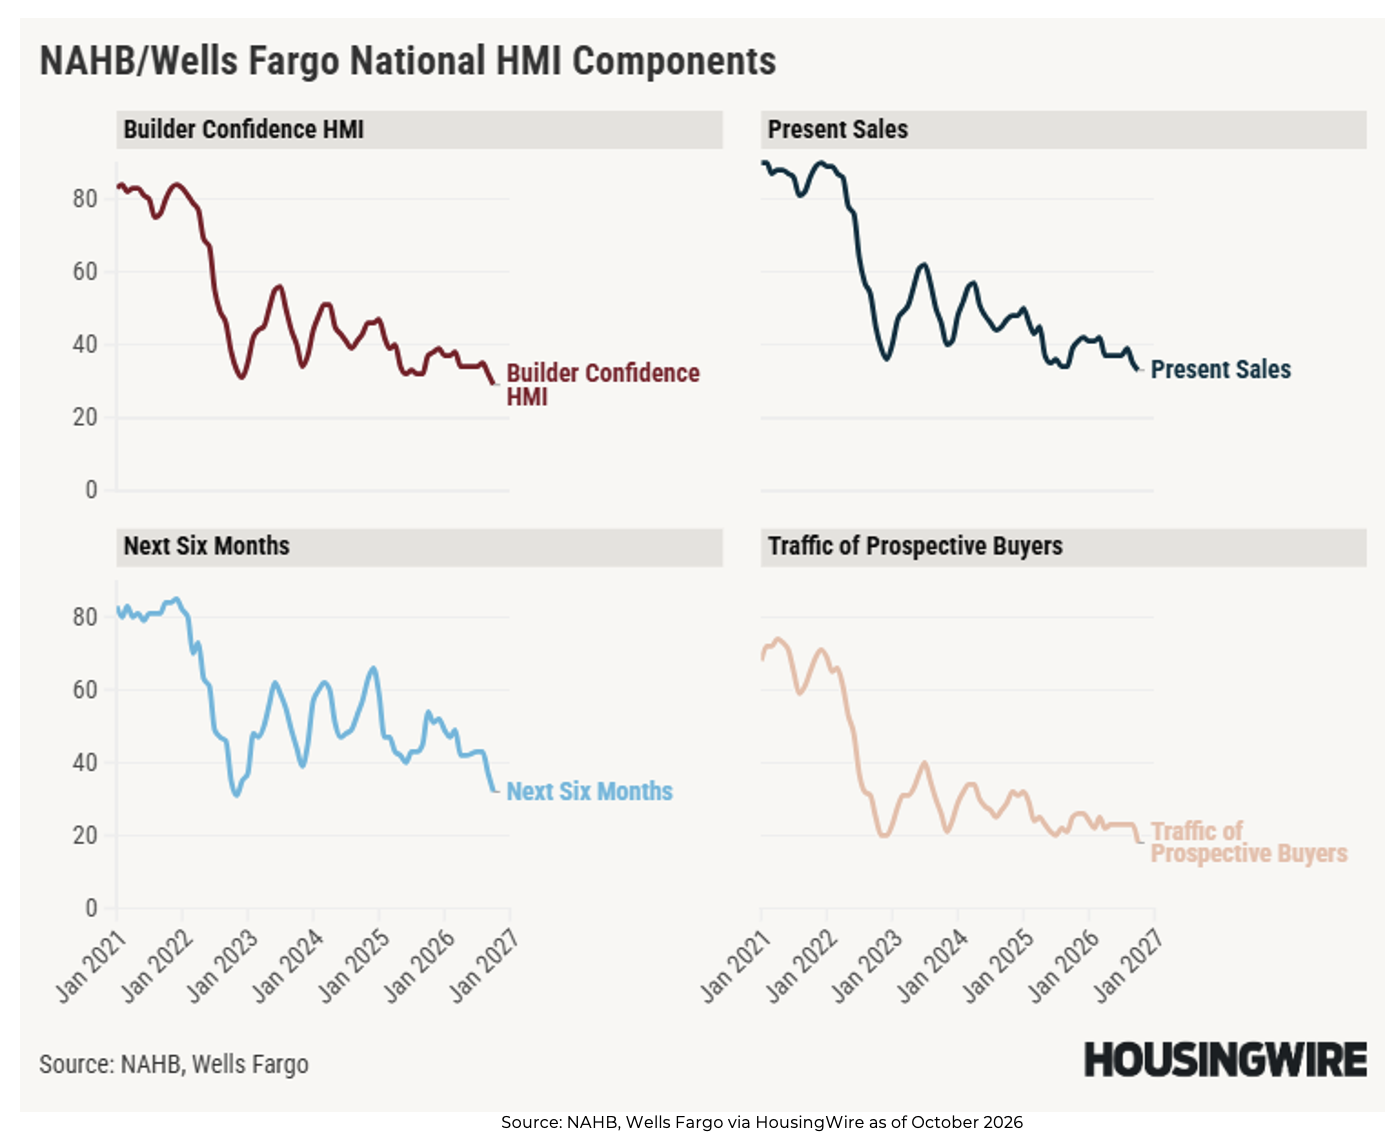
Mike: U.S. homebuilder sentiment fell to 29 in October, its lowest since June 2012, as mortgage rates climbed above 7%.
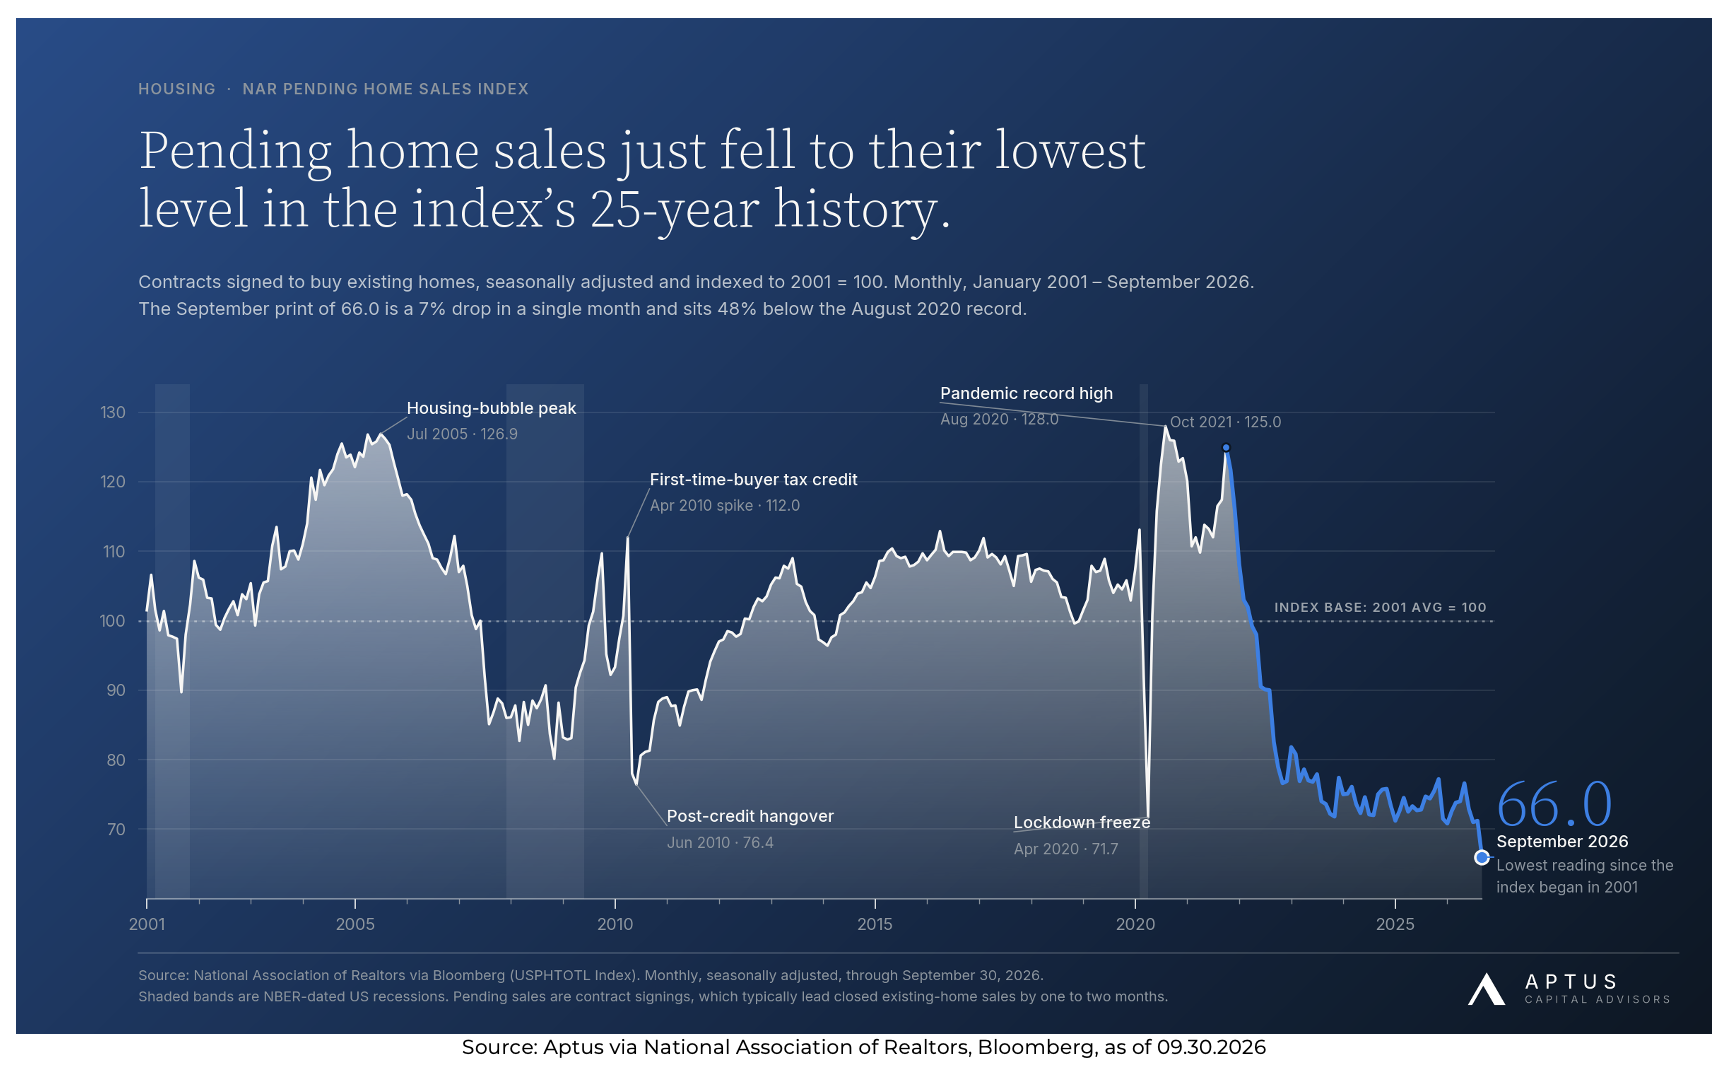
John Fox: Pending home sales dropped 7% in September to 66.0, the lowest reading in the index’s 25-year history and 48% below the August 2020 record. Contract signings lead closed sales by a month or two so the weakness has not fully shown up in existing-home sales yet.
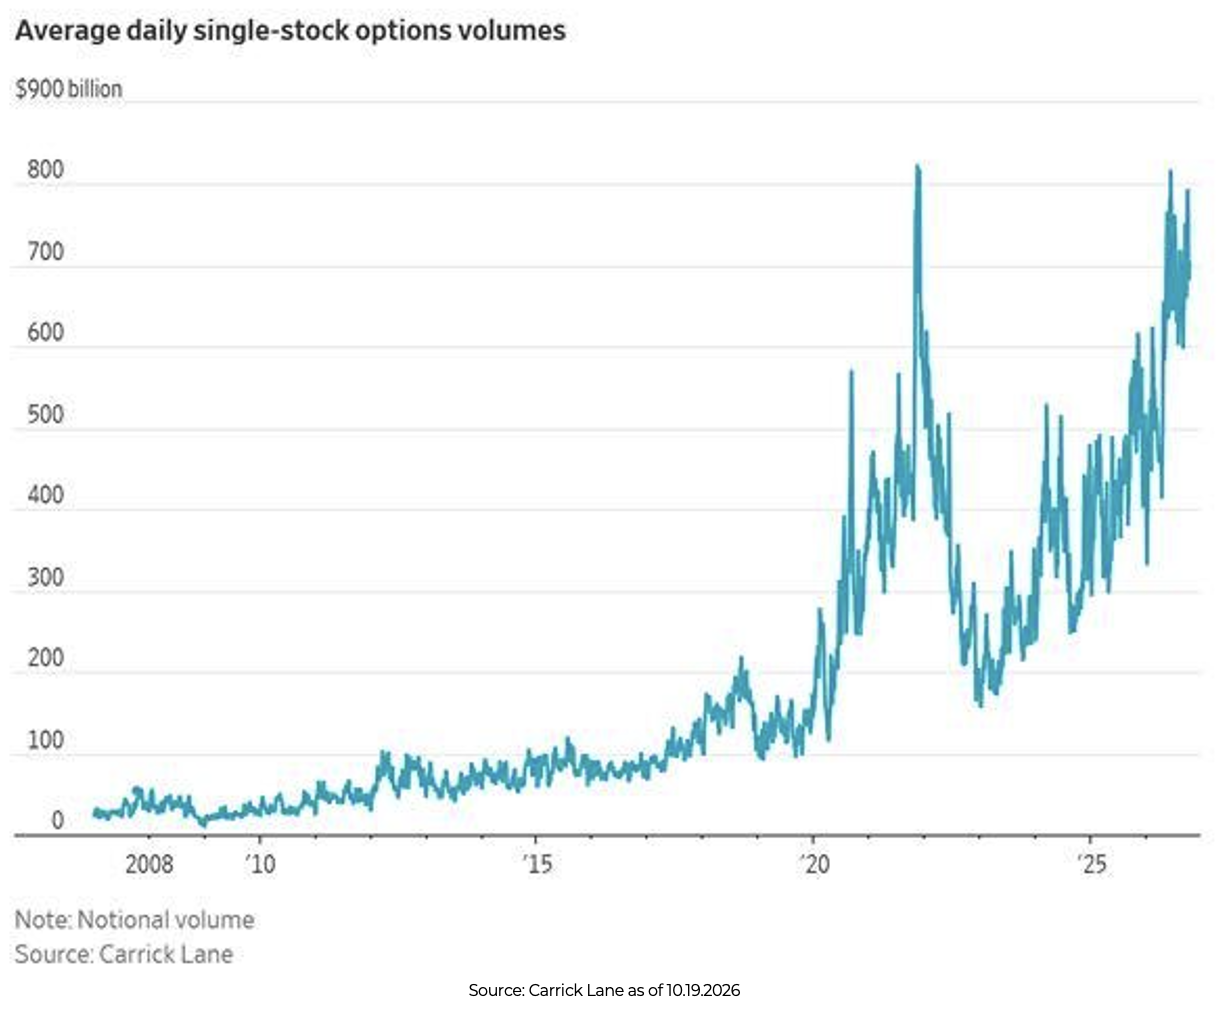
Ten: Single-stock options volume is averaging close to $800 billion in notional per day. That is back near the 2021 peak and roughly 10x where it stood a decade ago.
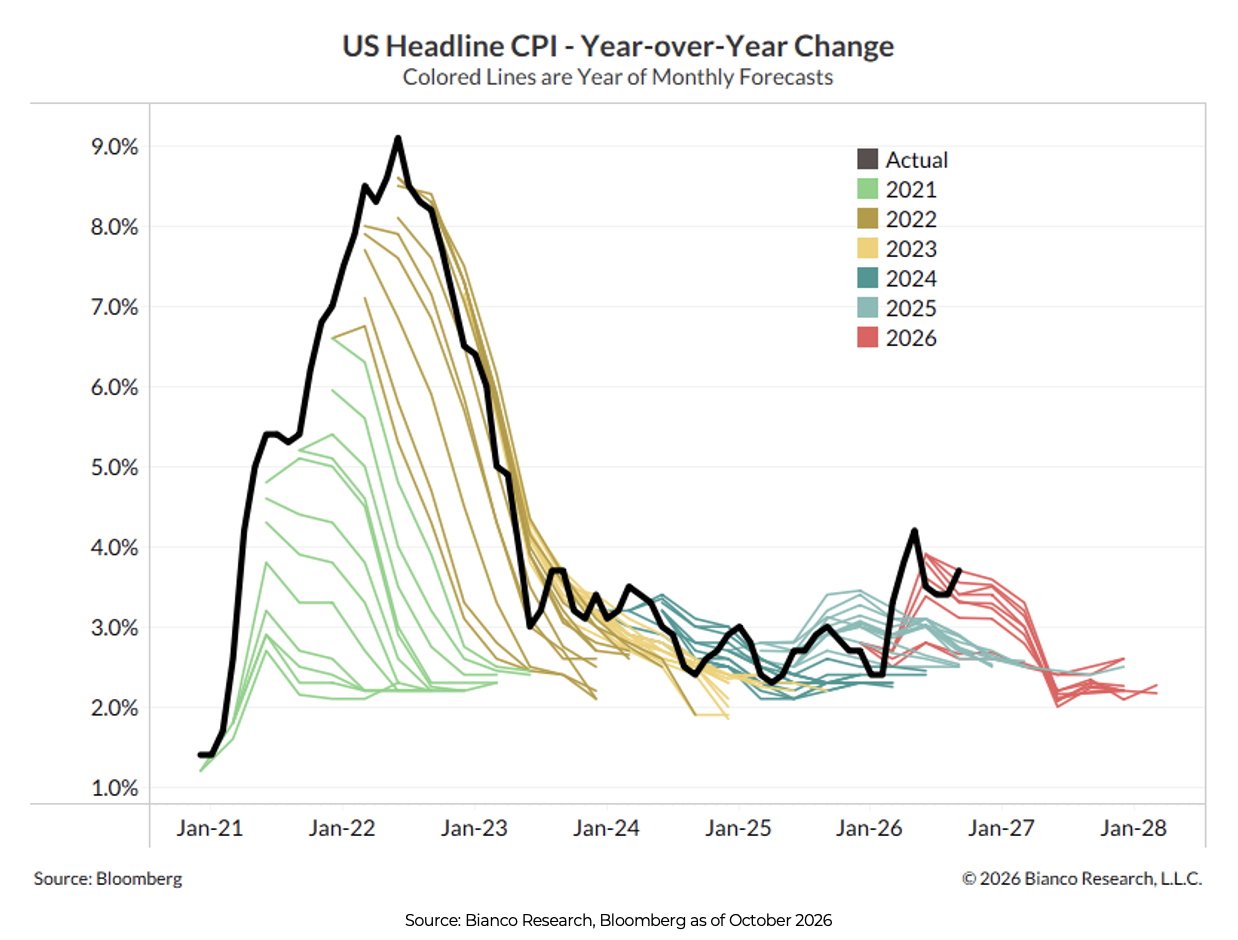
Brian: Every year, consensus CPI forecasts bend back toward 2% within 18 months no matter where inflation actually is. The 2026 lines are drawing the same glide path from 3.7% to 2.2%, which has already missed in both directions.
Disclosures
Past performance is not indicative of future results. This material is not financial advice or an offer to sell any product. The information contained herein should not be considered a recommendation to purchase or sell any particular security. Forward-looking statements cannot be guaranteed.
Projections or other forward-looking statements regarding future financial performance of markets are only predictions and actual events or results may differ materially.
This commentary offers generalized research, not personalized investment advice. It is for informational purposes only and does not constitute a complete description of our investment services or performance. Nothing in this commentary should be interpreted to state or imply that past results are an indication of future investment returns. All investments involve risk and unless otherwise stated, are not guaranteed. Be sure to consult with an investment & tax professional before implementing any investment strategy. Investing involves risk. Principal loss is possible.
Advisory services are offered through Aptus Capital Advisors, LLC, a Registered Investment Adviser registered with the Securities and Exchange Commission. Registration does not imply a certain level of skill or training. More information about the advisor, its investment strategies and objectives, is included in the firm’s Form ADV Part 2, which can be obtained, at no charge, by calling (251) 517-7198. Aptus Capital Advisors, LLC is headquartered in Fairhope, Alabama. ACA-2610-32.